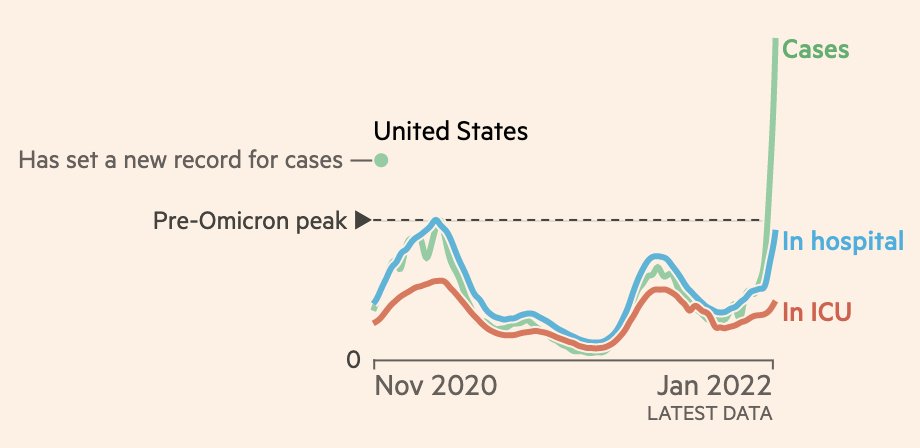
NEW chart for US Covid-watchers:
Key question with Omicron wave is whether severe disease — hospitalisations & ICU — decouples from cases.
In the UK it has, but there are signs the US decoupling is weaker, perhaps due in part to lower vax rates.
Track it here for every state:
Key question with Omicron wave is whether severe disease — hospitalisations & ICU — decouples from cases.
In the UK it has, but there are signs the US decoupling is weaker, perhaps due in part to lower vax rates.
Track it here for every state:

Here’s a quick recap of how to read these charts:
Black dotted line is peak level for each metric before Omicron arrived.
Crossing that line means a new record has been set in recent days.
I’ve put a little coloured circle below the name of each state to indicate new records.
Black dotted line is peak level for each metric before Omicron arrived.
Crossing that line means a new record has been set in recent days.
I’ve put a little coloured circle below the name of each state to indicate new records.

For example, almost all states in the north-east have set new records for cases in recent days.
New Jersey, Maryland and DC have also seen hospitalisations hit an all-time high, and the latter two are now also at record Covid ICU occupancy.
New Jersey, Maryland and DC have also seen hospitalisations hit an all-time high, and the latter two are now also at record Covid ICU occupancy.

In Florida on the other hand, Delta wave was so fierce that relative to that, Omicron hospitalisations are so far less than half as high
But as you can hosp & ICU are still rising steeply. Anything close to Delta peak here would be a sign that the US is faring much worse than UK
But as you can hosp & ICU are still rising steeply. Anything close to Delta peak here would be a sign that the US is faring much worse than UK

Here’s the full graphic again for all states

And if you want to drill down into more detail on the precise hospital situation at the local level, I recommend this brilliant tracker from @bhrenton and @jeremyfaust
https://twitter.com/hspter/status/1478600762137579524
And for those wondering what I mean when I say lower vax rates in US than UK, it’s this:

Edit: error in the national-level ICU data on my United States chart. Shape was right, level was not.
Should look like the one of the left (incorrect version on right)
Should look like the one of the left (incorrect version on right)

• • •
Missing some Tweet in this thread? You can try to
force a refresh