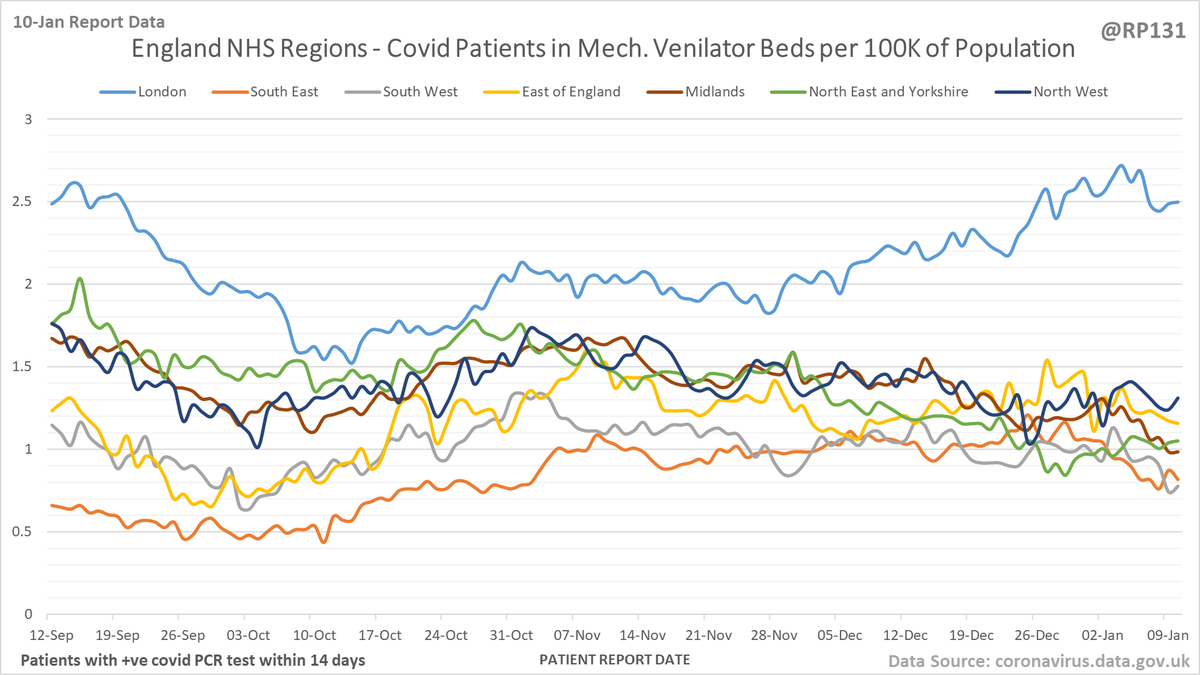
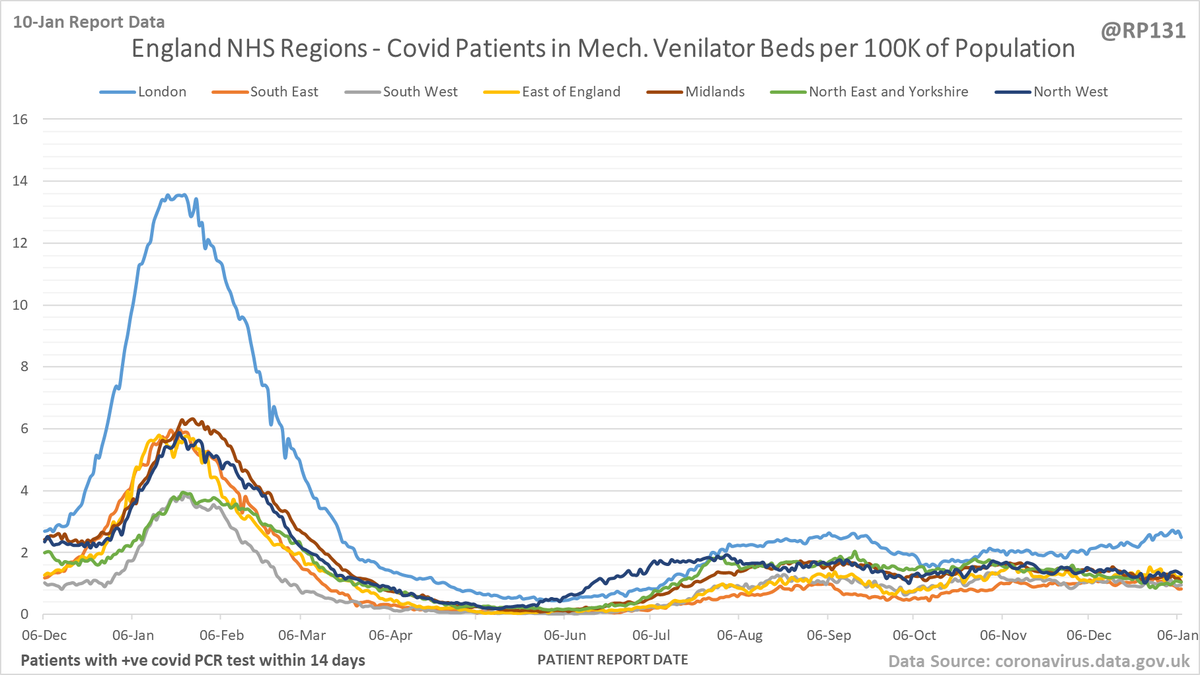
Latest view on England mechanical ventilator beds (with a positive covid test), as of 8am on 10-Jan.
The count is now 707, a reduction of 70 (9%) in the last week.
The count is now 707, a reduction of 70 (9%) in the last week.

Also including London in main thread due to current focus on that region.
The count is now 225, a reduction of 13 (5%) in the last week.
The count is now 225, a reduction of 13 (5%) in the last week.

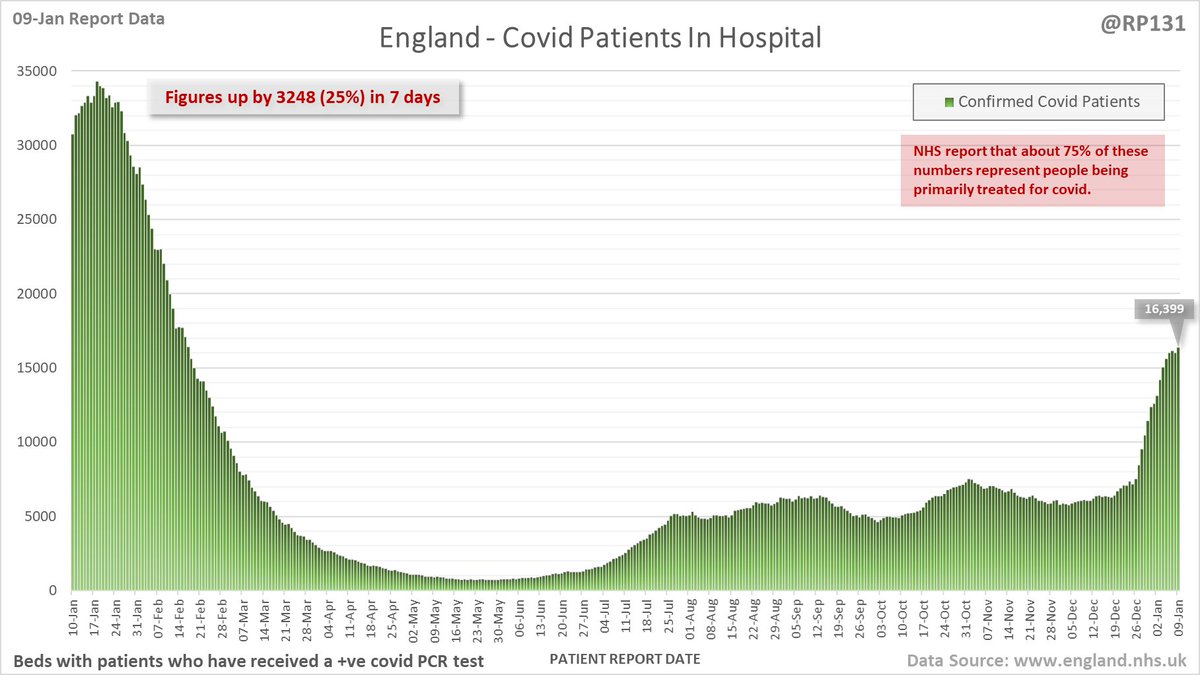
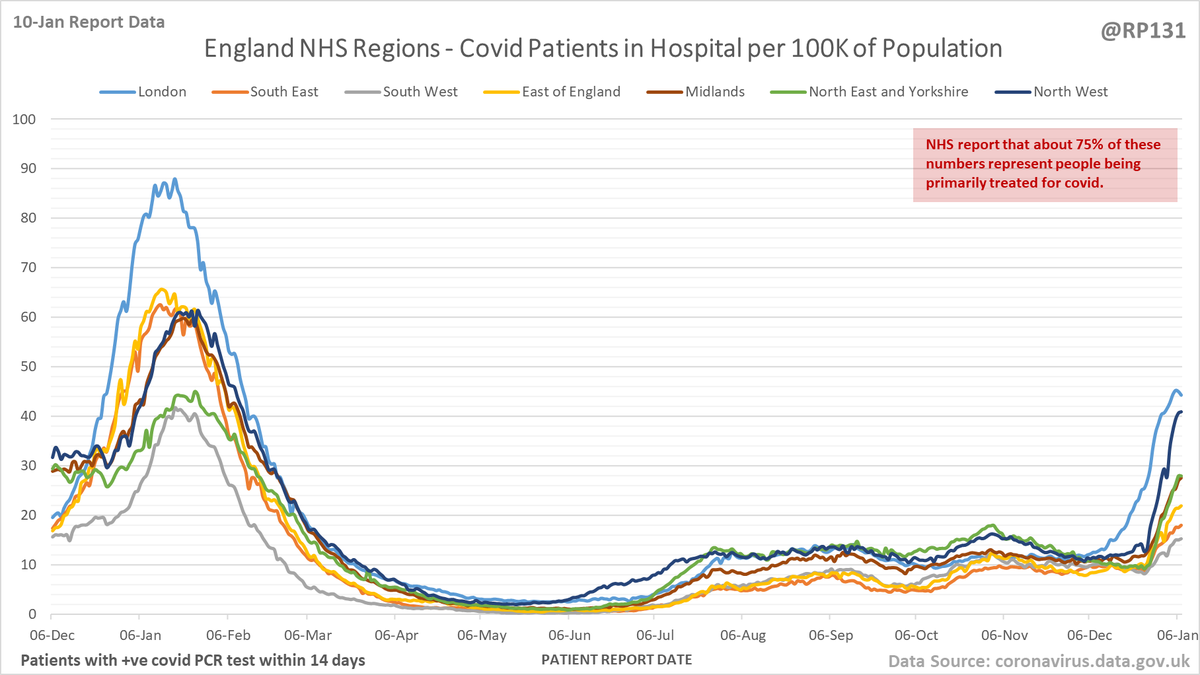
Latest view on England patients with a positive covid test currently in hospital, as of 8am on 10-Jan.
The count is now 17,120, an increase of 2910 (20%) in the last week.
The count is now 17,120, an increase of 2910 (20%) in the last week.

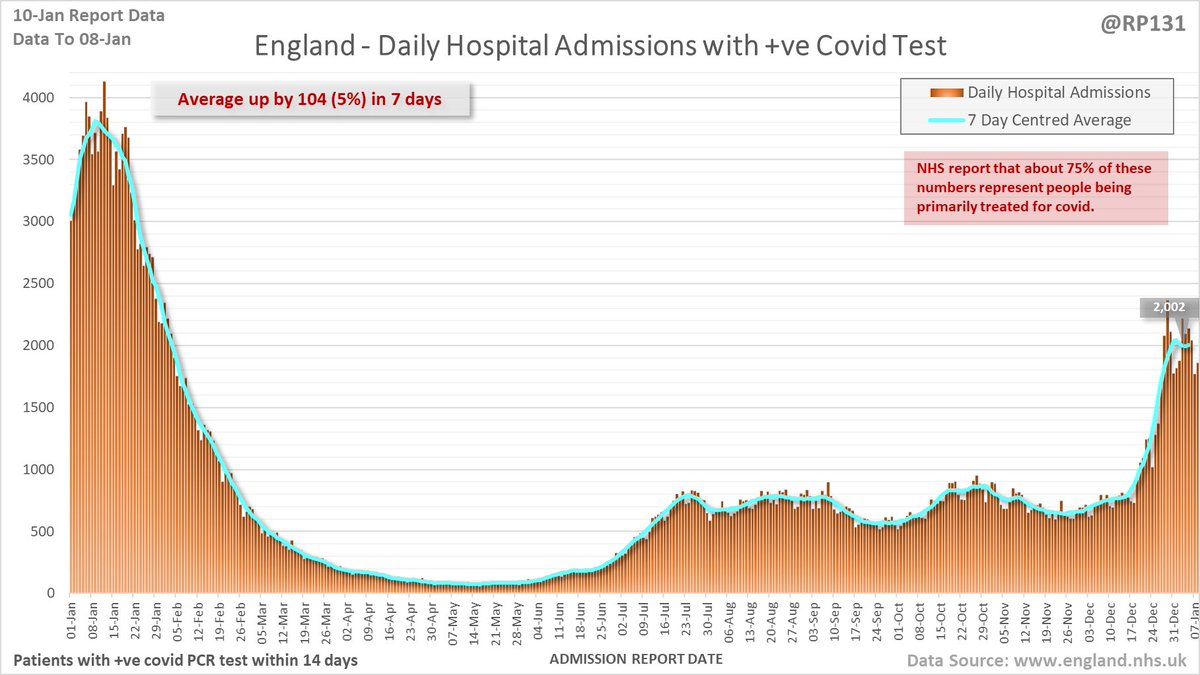
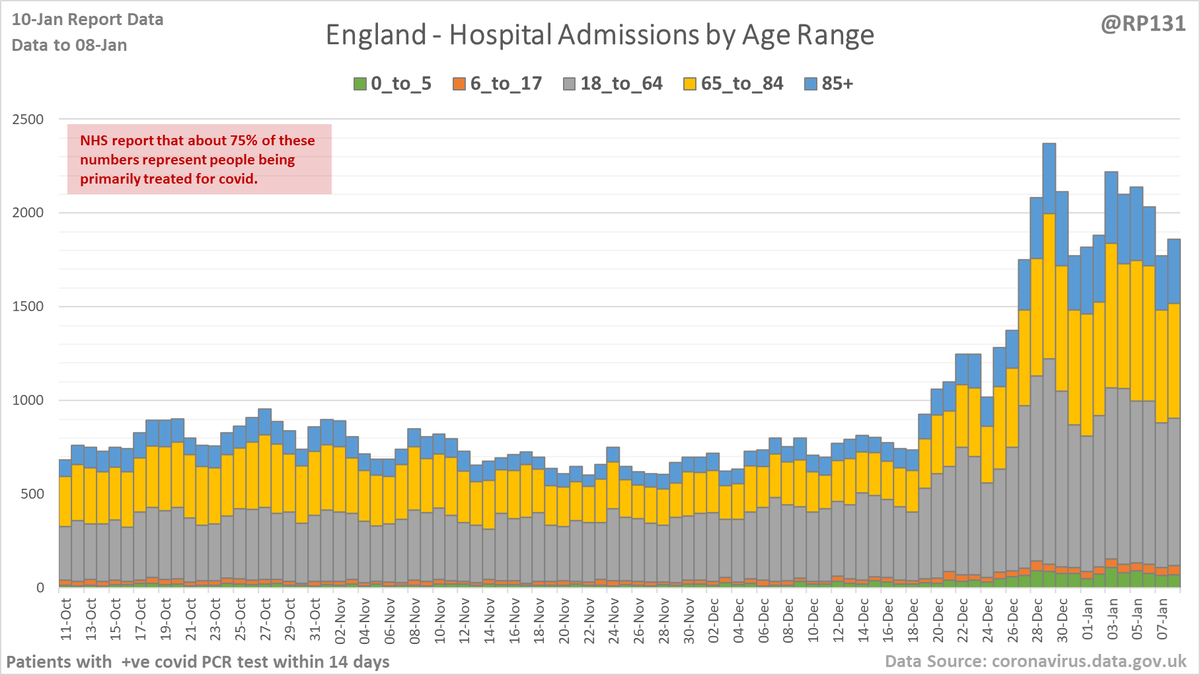
Latest view on England covid hospital admissions (as of 10-Jan) with 1,862 reported for 08-Jan.
The 7 day average is now 2002, an increase of 104 (5%) in the last week.
The 7 day average is now 2002, an increase of 104 (5%) in the last week.
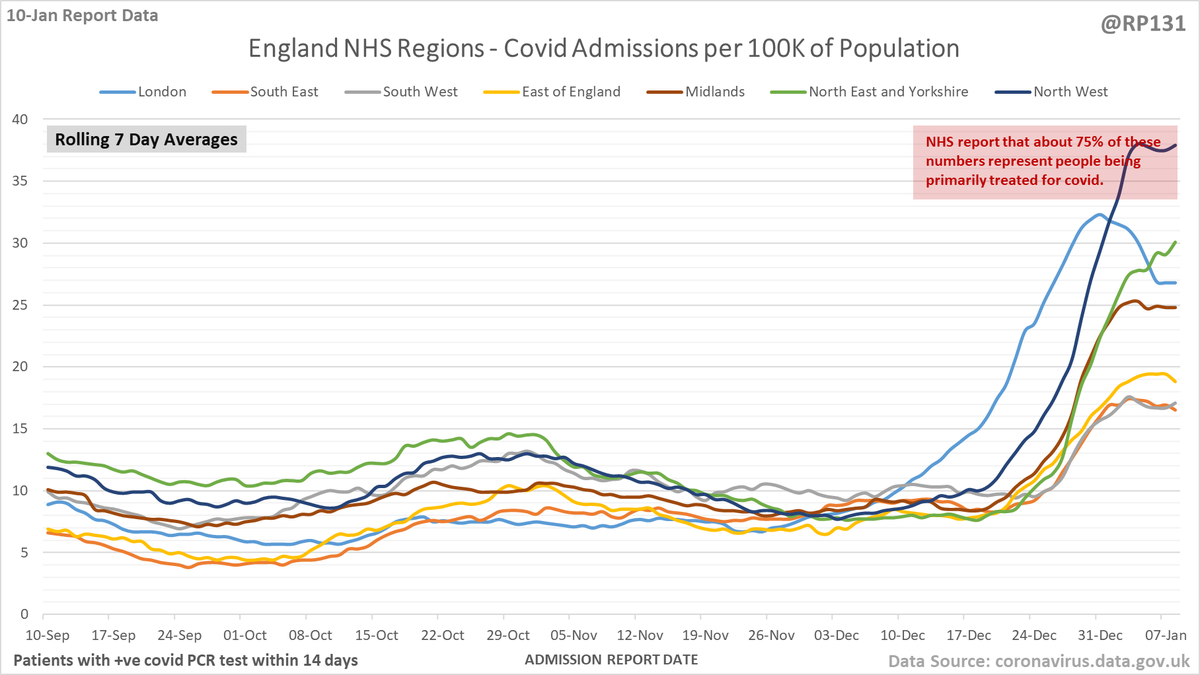
Charts by England NHS Region of Admissions, Patients and Mechanical Ventilator Beds per 100K of population (to allow relative comparison).


Plus a set extended out to 400 days to give a bit more historical context.


Age ranges of England hospital admissions. Note this age-range data lags a day or so behind the above totals data.
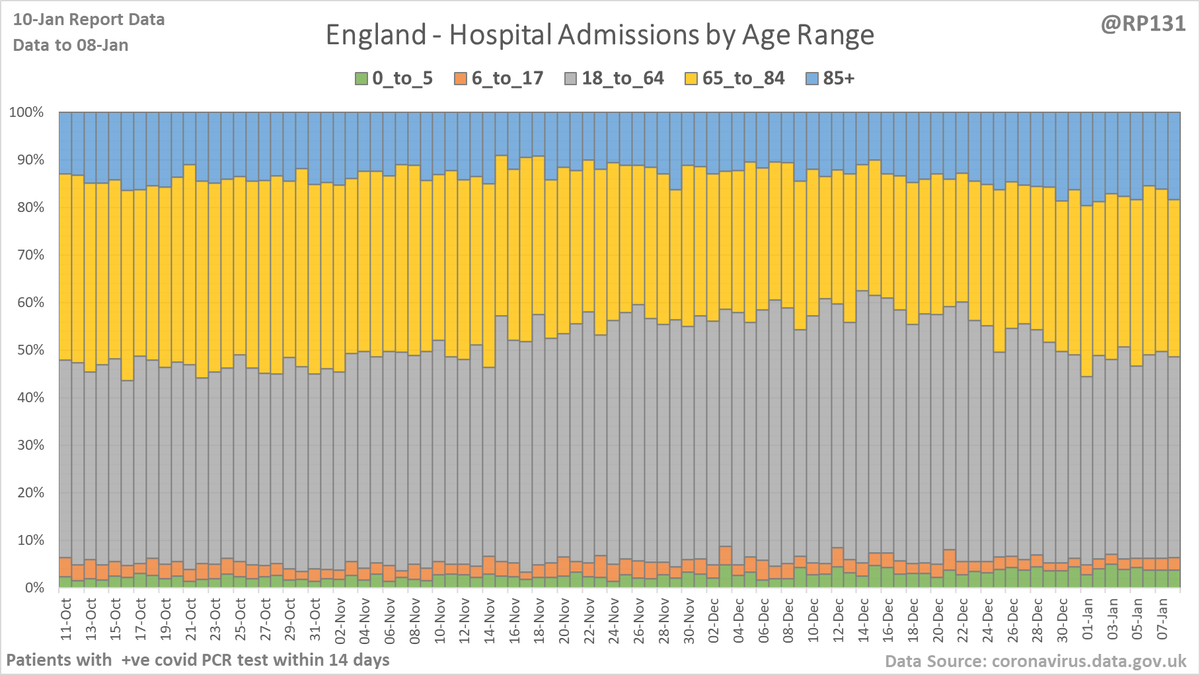
Percentage view of age ranges of England hospital admissions.
Some additional content (mainly variations of the above charts) is available here: …ddatashare.s3-eu-west-1.amazonaws.com/Hospital/Hospi…
Chart to compare the Admissions projections from the 8-Sep SPI-M-O consensus statement with actuals.
This are the projections being used as basis for calls for additional restrictions.
The document says the likely trajectory is between green and blue lines.
This are the projections being used as basis for calls for additional restrictions.
The document says the likely trajectory is between green and blue lines.

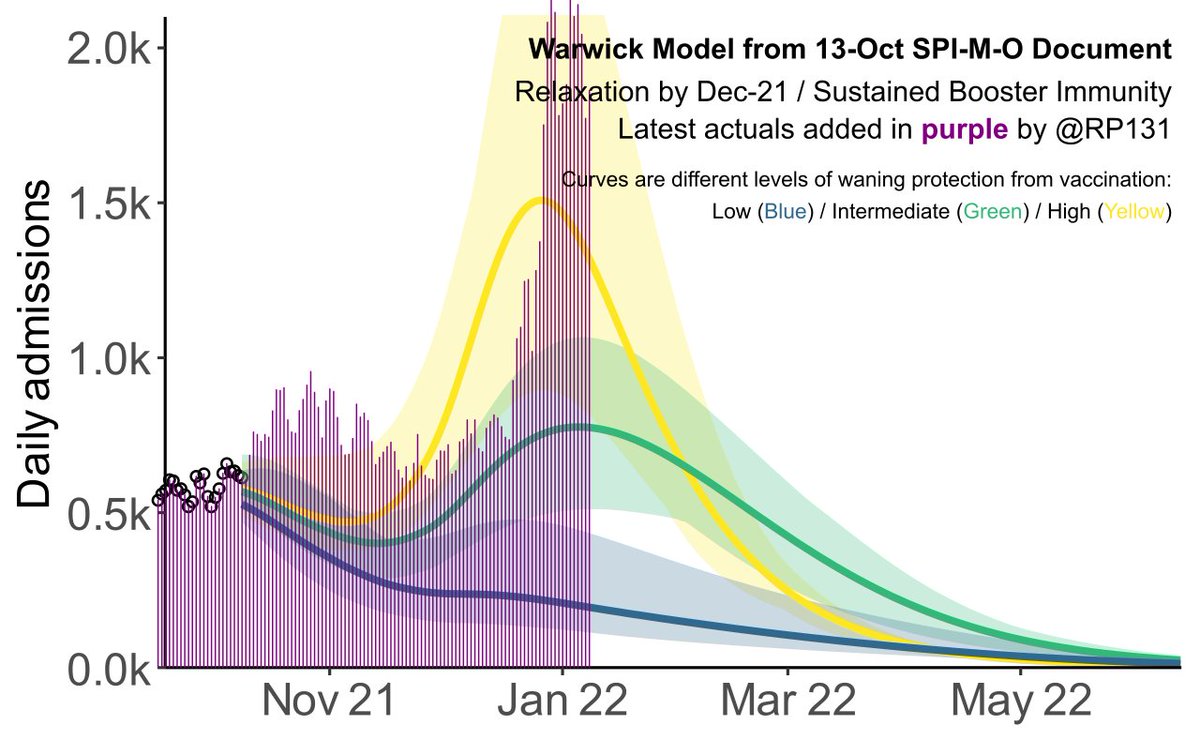
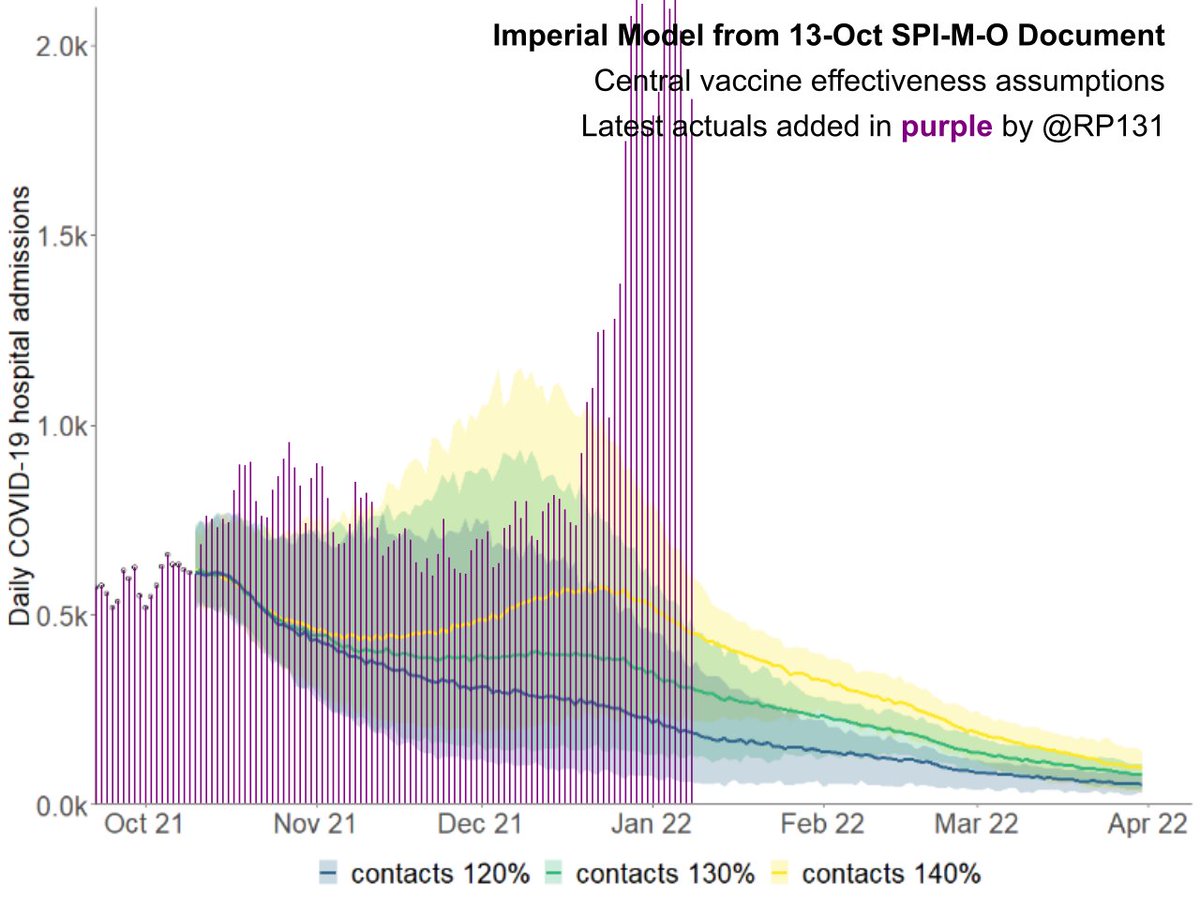
Selection of models from the 13-Oct SPI-M-O document for Autumn/Winter scenarios with the latest actuals.
Unusually, they have under-estimated but still goes to show how (as stated by the modellers themselves) they are not a reliable indicator of what will actually happen.
Unusually, they have under-estimated but still goes to show how (as stated by the modellers themselves) they are not a reliable indicator of what will actually happen.


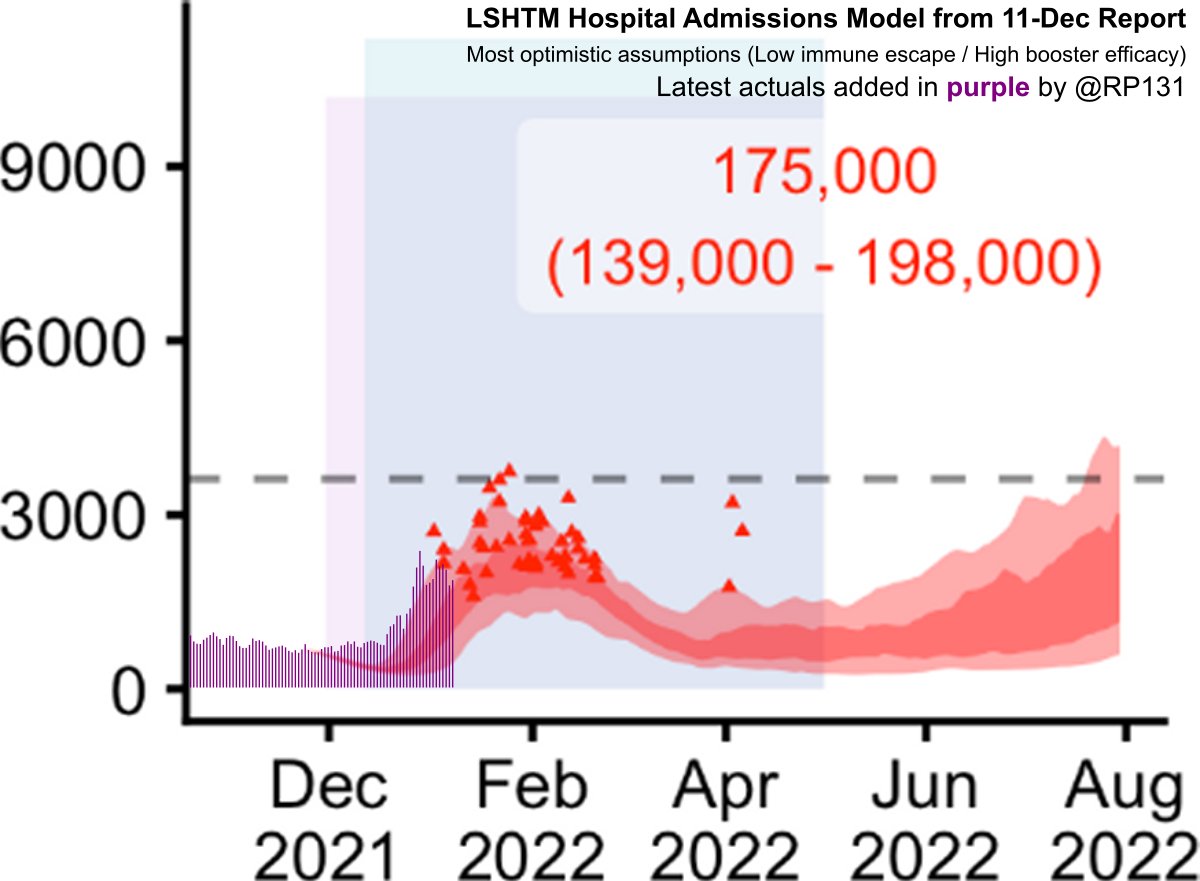
The most optimistic models for Admissions / Deaths from the 11-Dec LSHTM report on potential consequences of Omicron, with latest actuals applied.
Note that the report is marked as "PRELIMINARY � NOT PEER REVIEWED" and "work in progress".
Note that the report is marked as "PRELIMINARY � NOT PEER REVIEWED" and "work in progress".

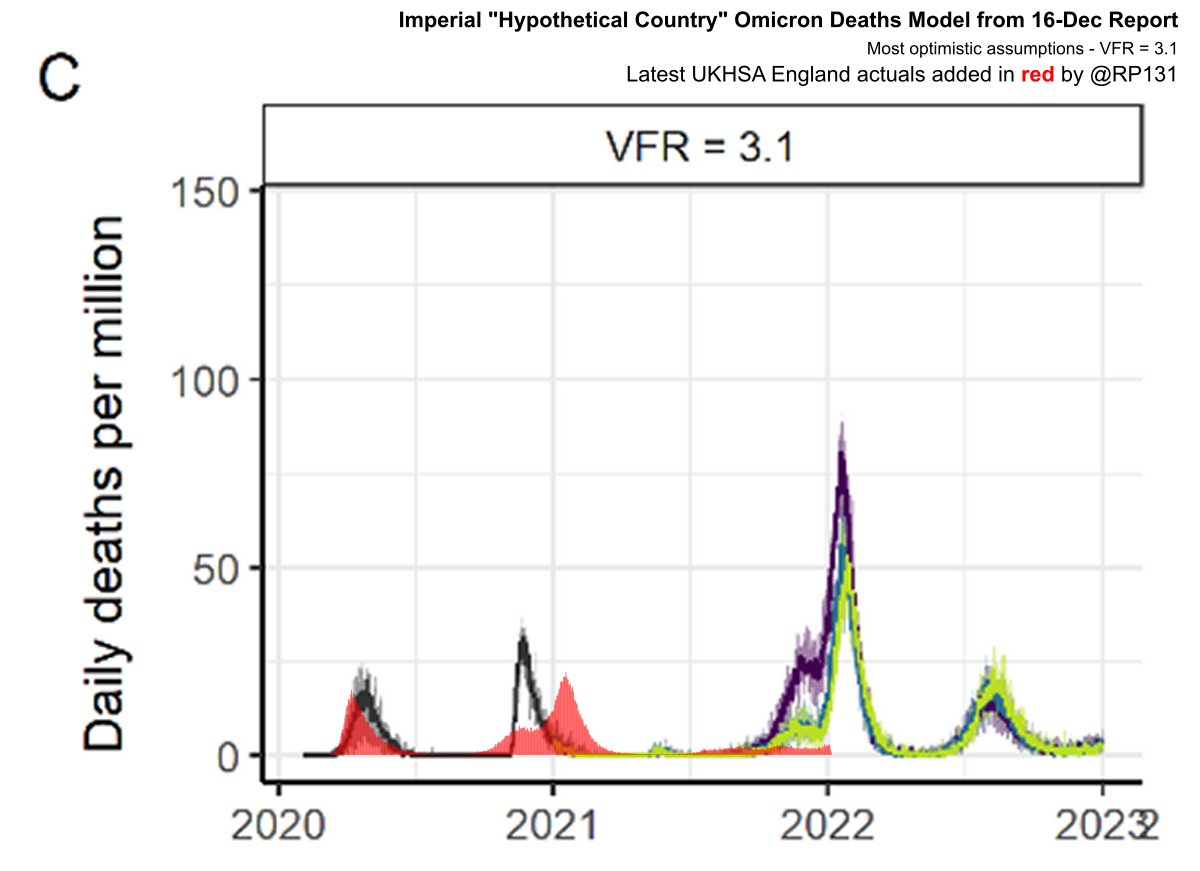
Imperial "Hypothetical Country" Omicron Deaths Model from 16-Dec Report with latest England actuals applied in red. A bit rough due to low resolution input image but good enough to illustrate how the model doesn't match England reality.
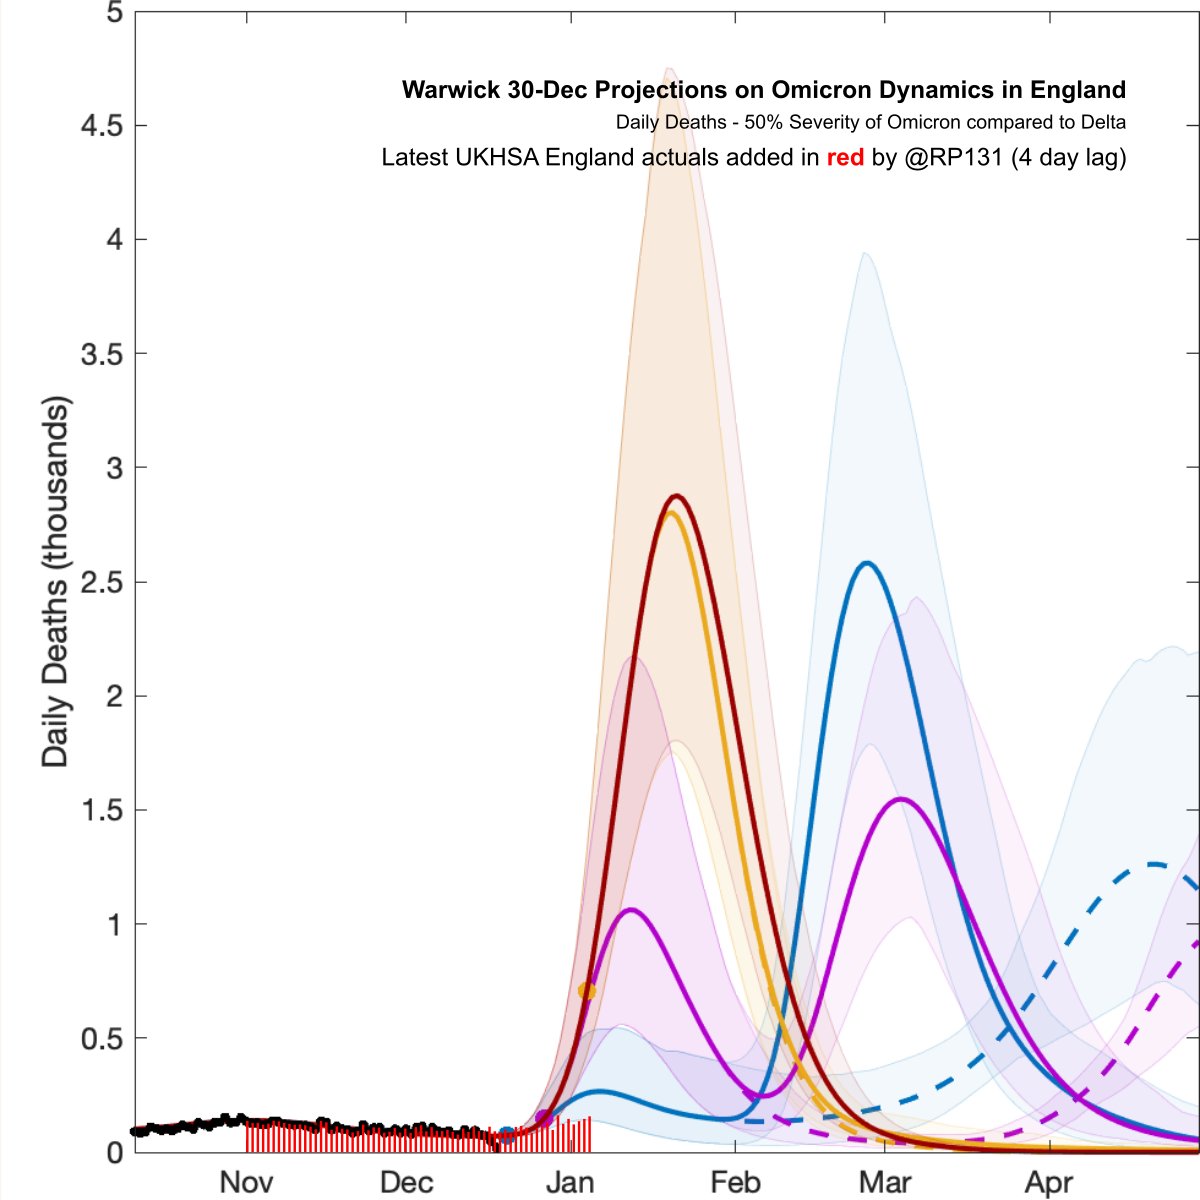
Warwick 30-Dec Projections based on Early Omicron Variant Dynamics in England with latest UKHSA actuals applied in red. I think it says that if Omicron is half as bad as Delta then with no further restrictions (dark red line) we'll have 1000 deaths per day by 7th January.

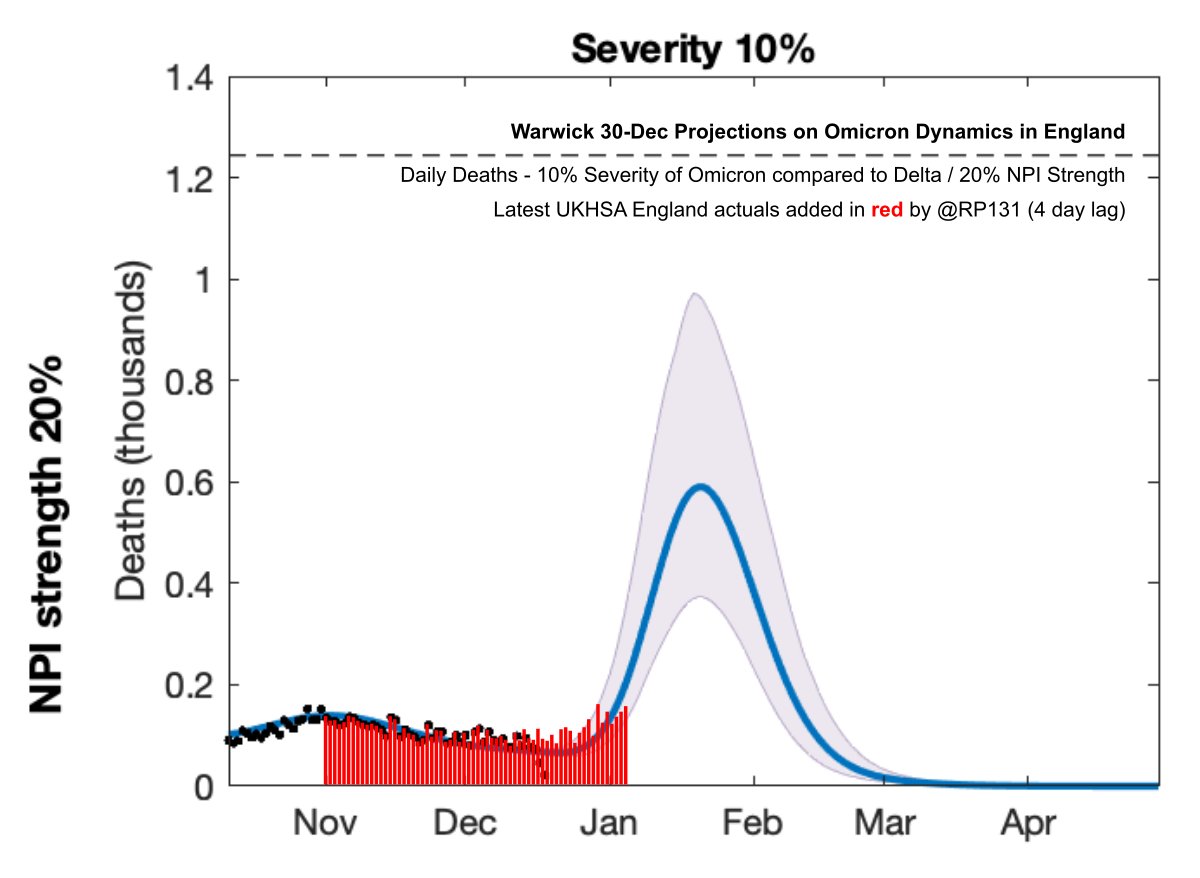
Also included in the 30-Dec Warwick document (considerably less prominently) is a model for Omicron being 10% as severe as Delta and with 20% strength of restrictions. This still has England at about 310 daily deaths by 07-Jan, growing to a peak of 600 later in the month.
• • •
Missing some Tweet in this thread? You can try to
force a refresh