What will the iconic @Keeling_curve graph of atmospheric CO2 concentrations need to look like in future if we're to limit global warming to 1.5°C?
The build-up of CO2 in the air has been accelerating
This build-up needs to slow within a few years, then stop & reverse
Thread⤵️
The build-up of CO2 in the air has been accelerating
This build-up needs to slow within a few years, then stop & reverse
Thread⤵️
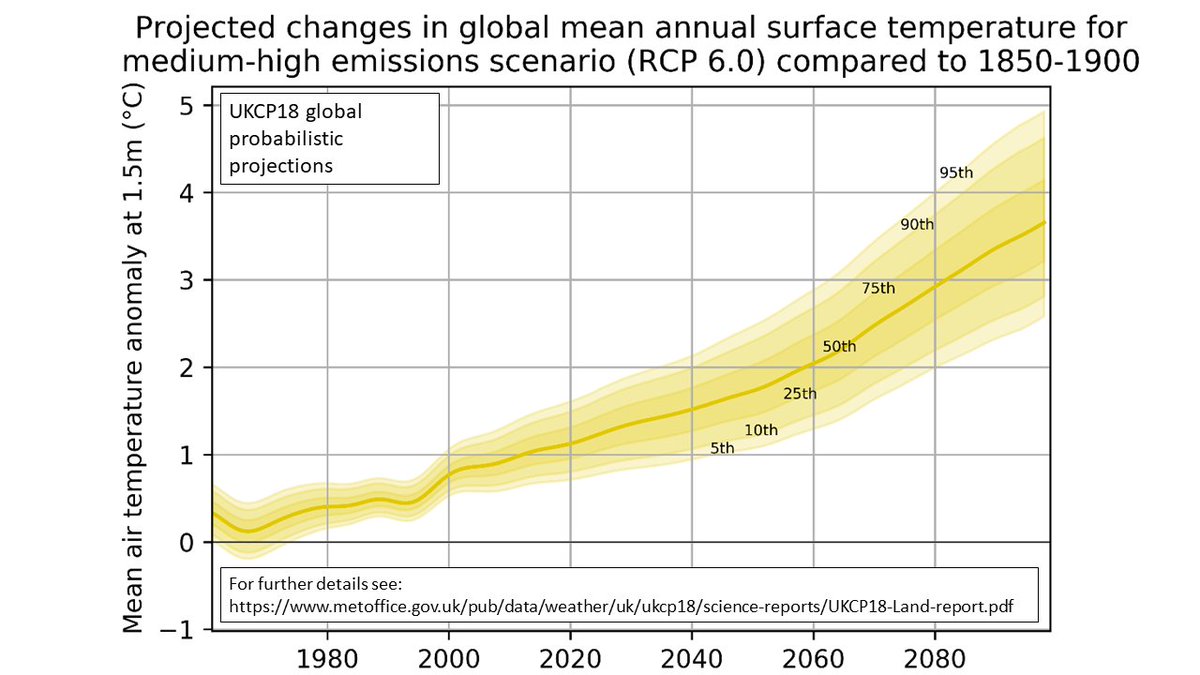
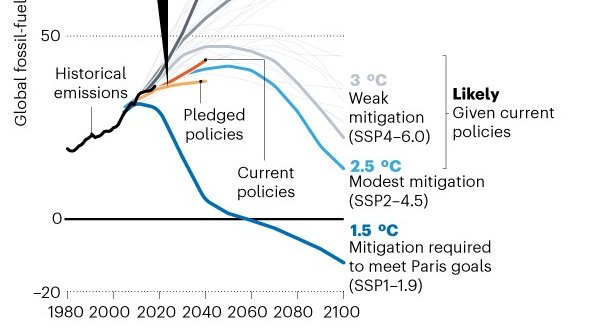
Our extended version of the Keeling Curve is based on the SSP1-1.9 scenario
With this scenario (light blue) the IPCC central estimate has warming reaching 1.5°C on average over 2021-2040, overshooting but returning below 1.5°C by the end of the century
ipcc.ch/report/ar6/wg1…
With this scenario (light blue) the IPCC central estimate has warming reaching 1.5°C on average over 2021-2040, overshooting but returning below 1.5°C by the end of the century
ipcc.ch/report/ar6/wg1…

Our @metoffice forecast of CO2 levels at Mauna Loa suggest that the rise from 2021 to 2022 will be 2.14 ± 0.52 ppm
This is slower than previous years, but not because human emissions are falling - it's due to stronger uptake of carbon by vegetation
metoffice.gov.uk/research/clima…
This is slower than previous years, but not because human emissions are falling - it's due to stronger uptake of carbon by vegetation
metoffice.gov.uk/research/clima…

The size of year-by-year increases in CO2 concentration (annual increments) varies due to changes in natural carbon sinks impacted by climate variability
CO2 rise:
faster in El Niño years (hotter, drier - less carbon uptake)
slower with La Niña (cooler, wetter -> more uptake)
CO2 rise:
faster in El Niño years (hotter, drier - less carbon uptake)
slower with La Niña (cooler, wetter -> more uptake)

We're currently in a La Niña, so expect a smaller CO2 rise compared to most recent years (2.1 ppm vs average of 2.45 ppm / year over the last ten years)
Nevertheless, we expect the rise from 2021 to be faster than previous La Niña years because human emissions have increased
Nevertheless, we expect the rise from 2021 to be faster than previous La Niña years because human emissions have increased

The CO2 rise of 2.1 ppm expected this year is close to the rate which the 1.5°C scenario (SSP1-1.9) shows to for the next 5 years
SSP1-1.9 then has the CO2 rise slowing to 1 ppm / year around 2030, reaching zero in the early 2040s
After that, the scenario has a fall in CO2
SSP1-1.9 then has the CO2 rise slowing to 1 ppm / year around 2030, reaching zero in the early 2040s
After that, the scenario has a fall in CO2

But crucially, the expected slower rise this year is only happening because of the free bonus of stronger carbon sinks
Without La Niña the CO2 rise would be at higher levels
For CO2 concentrations to track the 1.5°C scenario, global emissions would need to start to falling now
Without La Niña the CO2 rise would be at higher levels
For CO2 concentrations to track the 1.5°C scenario, global emissions would need to start to falling now

Another important point about this year's CO2 forecast:
In April / May, monthly average CO2 concentrations at Mauna Loa will exceed 420 ppm for the first time
This will be the highest level of CO2 in the atmosphere for over 2 million years
ipcc.ch/report/ar6/wg1…
In April / May, monthly average CO2 concentrations at Mauna Loa will exceed 420 ppm for the first time
This will be the highest level of CO2 in the atmosphere for over 2 million years
ipcc.ch/report/ar6/wg1…

Incidentally, that splendid brainbox @chrisd_jones wrote this excellent paper on our CO2 forecasting for the scientific journal for young people Frontiers for Young Minds @FrontYoungMinds - worth a read!
https://twitter.com/chrisd_jones/status/1481180750267432962
• • •
Missing some Tweet in this thread? You can try to
force a refresh