Saagar Jha Profile picture
Jan 12, 2022 16 tweets 4 min read Read on X
Tip: when expanding an Xcode XIP archive, use the command line (xip --expand) rather than Archive Utility. It’s at least 25% faster–sometimes even twice as fast, depending on the circumstances. They both call into the Bom API, so I profiled both to see why there’s a difference.
Decompressing a XIP is fairly straightforward: Bom runs file operations (which don’t generally benefit from parallelization) on one main thread and then spawns worker threads as necessary for CPU-bound tasks. The most obvious one is decompression, of course. Screenshot of an Instruments trace of xip. Total time on the
Xcode is massive–it’s over half a million files. Its XIP is more than 10 GB, and if fully expanded on disk it’d take up over 30 GB of space. Fortunately, it doesn’t have to be: APFS supports transparent compression, and Apple has marked most of the bundle as being able to use it.
This feature lets Xcode use less than 20 GB of space on-disk if extracted properly, which both the command line and GUI tools do. (Sadly, Archive Utility’s free space check uses the full, uncompressed size, so it will often reject the archive even when there’s plenty of space.)
Anyways, the decompression process for a XIP is fairly straightforward: read files out from the XIP’s LZMA stream, recompress them with LZFSE if possible, then write them to disk. The compression is handled by AppleFSCompression, and it’s more than happy to parallelize the task.
That’s what all the worker threads are doing, by the way. But if you have even a handful of CPU cores you’ll notice it has a really hard time keeping all of them busy. The bottleneck is *not* the actual de- and re-compression, but writing out the files to disk! Time profiler timeline of xip, PID 96796. The state is unkno
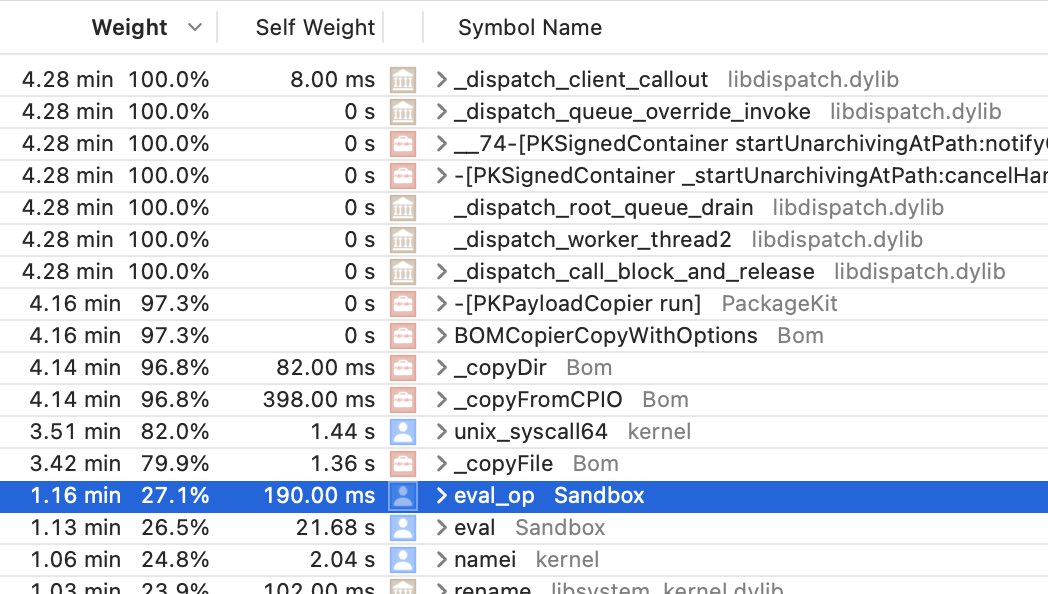
Specifically, it’s the creation of those half a million files that really hurts overall performance. The “driver” thread is unable to create files fast enough to keep the worker thread pool busy doing actual work on the CPU, because it’s blocked by file operations in the kernel.
Part of this time, of course, is waiting to write to disk. But SSDs are fast, and the thread is still using a lot of CPU time. What’s it doing? Well, a lot of it is APFS bookkeeping, which is slow but not particularly surprising to encounter. But there’s some more going on…
Before any system call even has a chance to touch the disk, macOS needs to make sure that it has permission to do so. In this case all the accesses will succeed, but the kernel still needs to check, and it asks Sandbox.kext to do so. A policy is evaluated to verify the access.
How expensive is this evaluation? Pretty expensive, it turns out. Filesystem operations might spend up to 30% of their time on CPU just evaluating sandbox policies! And all of these run synchronously on that one thread, so they block everything else from proceeding. Time profile of the “driver” _dispatch_worker_thread2, s
Why is xip faster? First, it’s a command line tool, rather than a GUI app. macOS throttles apps that are obscured or minimized after a while, which pretty much everyone does to Archive Utility and can easily make the process take twice as long.
Secondly, I found that xip consistently spent less time in Sandbox evaluation. I can’t be sure why, but my guess is that it has a simpler profile (it’s basically unsandboxed…) so the policy might be simpler to check. All other things being equal, it’s still 25% faster overall.
Plus, you might get to skip this: macOS Quarantine verification dialog, with a FileVault icon
Since Xcode expansion is kernel-bound, an amusing test might be to try decompressing it on Linux and seeing how it compares. My impression is that they care more about filesystem performance, but it’d be interesting to see how it fares.
(This thread broke my Twitter client–the repeated tweet is just an artifact of that.)

• • •

Missing some Tweet in this thread? You can try to force a refresh
 

Keep Current with Saagar Jha

Saagar Jha Profile picture

Stay in touch and get notified when new unrolls are available from this author!

Read all threads

This Thread may be Removed Anytime!

PDF

Twitter may remove this content at anytime! Save it as PDF for later use!

Try unrolling a thread yourself!

how to unroll video
  1. Follow @ThreadReaderApp to mention us!

  2. From a Twitter thread mention us with a keyword "unroll"
@threadreaderapp unroll

Practice here first or read more on our help page!

More from @_saagarjha

Jun 21, 2024
Finally got around to reading about Private Cloud Compute and let’s just say I’m not super impressed Frog is holding a box (presumably filled with cookies) as he converses with Toad.  Frog ran the inferencing in Private Cloud Compute. “There,” he said. “Now we can cryptographically attest that we do not see the request.” “But you control the hardware root of trust,” said Toad. “That is true,” said Frog.
Apple seems to just categorically fail at threat models that involve themselves. I guess for iPhone you just suck it up and use it anyway but for this the whole point is that it’s supposed to be as secure as on-device computation so this is kind of important
Even shelving insider threat, there are a lot of words for “we did TPM”. Which as everyone knows (at least, once @DontStealMacOSY has done their job) is designed around a long chain of things that verify each other–and is only as secure as the weakest link.
Read 8 tweets
Oct 28, 2022
Just finished reading this blog post, and I cannot recommend it more highly. It is *exceptionally* good. I am not an expert on kernel heap exploitation, so I probably shouldn’t comment on the technical details, but it really shows Apple understands what they’re doing here.
Mitigations are not created in a vacuum. This blog post not only acknowledges this fact but goes into detail on how the decisions were made to ship this. How well it will hold up is still up in the air, but it is clear that they (finally?) really nailed the design process.
They begin by presenting a specific common exploit flow they’d like to target, and it’s grounded in reality instead of, like, someone’s fever dream of what attackers do. There’s analysis of the underlying primitives that make it possible and the best place to disrupt the chain.
Read 7 tweets
Oct 25, 2022
Earthquake!
Sadly the shake alert came a bit after it started
Seems like a 5.1 centered in San Jose
Read 4 tweets
Oct 7, 2022
Some end of the week thought leadership: most programming languages are far more flexible than you’d think. When a language “isn’t a great fit for a particular environment” what it means is you should be extra mindful of the context you’re bringing it into.
There are some fundamental limits that are somewhat difficult to work around (getting a high level language on a Z80 might be more trouble than it’s worth) but beyond that languages matter far less than people think they do.
The actual problems people run into but conflate with languages is that they bring in a massive nonportable toolchain or they want all callbacks to run “the Python way” or add a bunch of low-quality dependencies or their JavaScript FFI just makes the rest of the code painful
Read 5 tweets
Oct 4, 2022
Here’s an interesting instance of quadratic complexity: adding and removing KVO observers on an object (FB11644022). A graph of its performance as I scale the number of observations is so perfect it could probably feel right at home in an algorithmic complexity textbook! Graph of observers versus time (in seconds) of adding and re
It’s probably not surprising in the least that observers are stored internally in a set of hash tables. But when you add observations on an object, part of the lookup process calls for computing a hash value over all the observers. This *would* be O(n) on each KVO update…
…except Foundation caches this hash value whenever the observers change, so lookups are O(1). This is good, except this just hoists the (one-time) O(n) calculation on each update of the observers, because adding and removing observers causes a full rehash.
Read 6 tweets
Sep 27, 2022
It’s kind of weird to describe it this way but to me Git is just one of those tools that really gets out of your way to let you work however you want, rather than actively fighting you because its authors didn’t understand that flexibility allow for all kinds of novel workflows.
Its design is really quite simple and clever. The default porcelain is pretty bad but it’s actually quite amazing how you can pretty much swap out whatever parts of it you don’t like. You can make all sorts of complex scripts to manipulate the repository, custom GUIs, …
I mean, it’s pretty clear the whole thing is designed to send patches to LKML. But the ability to use it for the GitHub PR flow, or stacked diffs, or even more exotic contribution models is a massive plus and (apparently) not at all trivial to achieve.
Read 14 tweets

Did Thread Reader help you today?

Support us! We are indie developers!


This site is made by just two indie developers on a laptop doing marketing, support and development! Read more about the story.

Become a Premium Member ($3/month or $30/year) and get exclusive features!

Become Premium

Don't want to be a Premium member but still want to support us?

Make a small donation by buying us coffee ($5) or help with server cost ($10)

Donate via Paypal

Or Donate anonymously using crypto!

Ethereum

0xfe58350B80634f60Fa6Dc149a72b4DFbc17D341E copy

Bitcoin

3ATGMxNzCUFzxpMCHL5sWSt4DVtS8UqXpi copy

Thank you for your support!

Follow Us!

:(