Richard 📊📉 Profile picture
Jan 17, 2022 8 tweets 3 min read Read on X
Dashboard for 17-Jan to explain the #covid19uk total death increase figure of 85.

For England, NHS data is merged by PHE for a net total of 63.

This moves the UK 7 day rolling average up by 1.2 to 263.6.
Date of death chart for England regions drawn with 7 day rolling averages of deaths per 1M population.
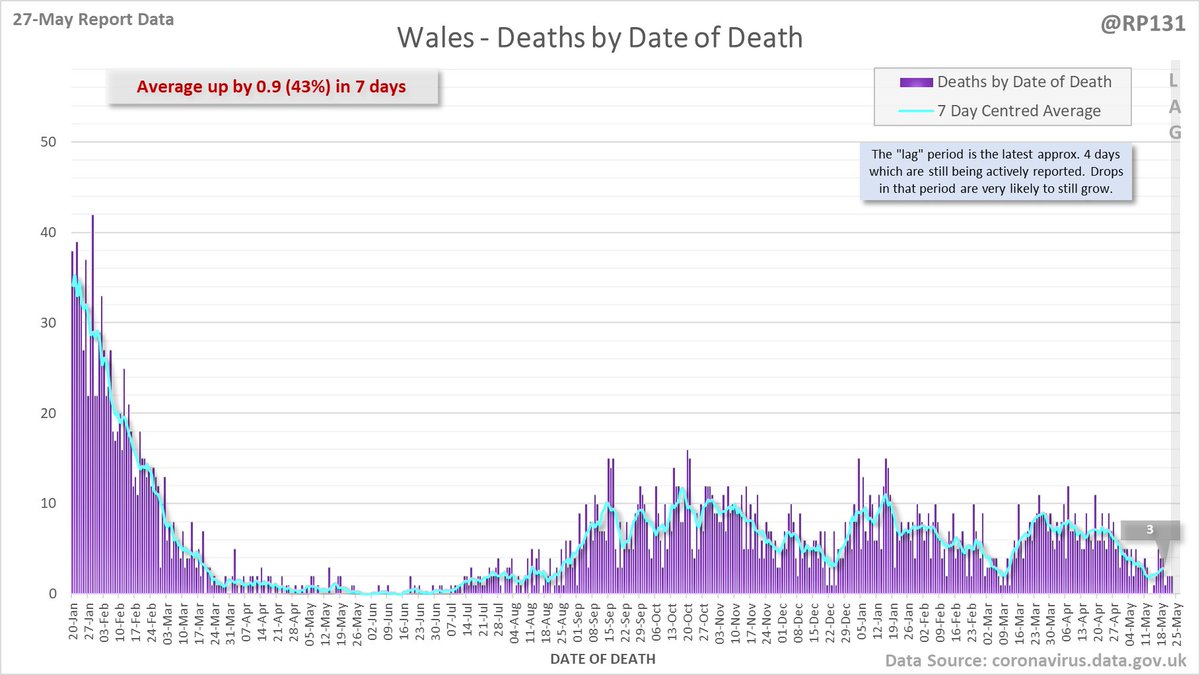
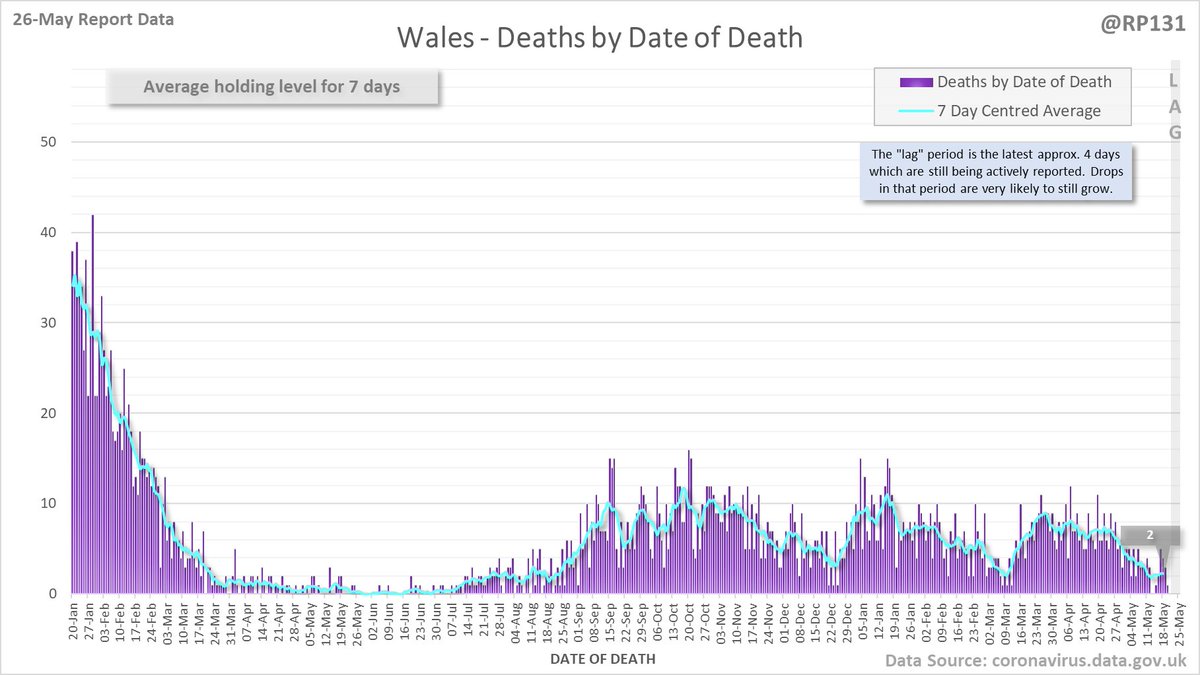
Date of death chart for UK nations drawn with 7 day rolling averages of deaths per 1M population.
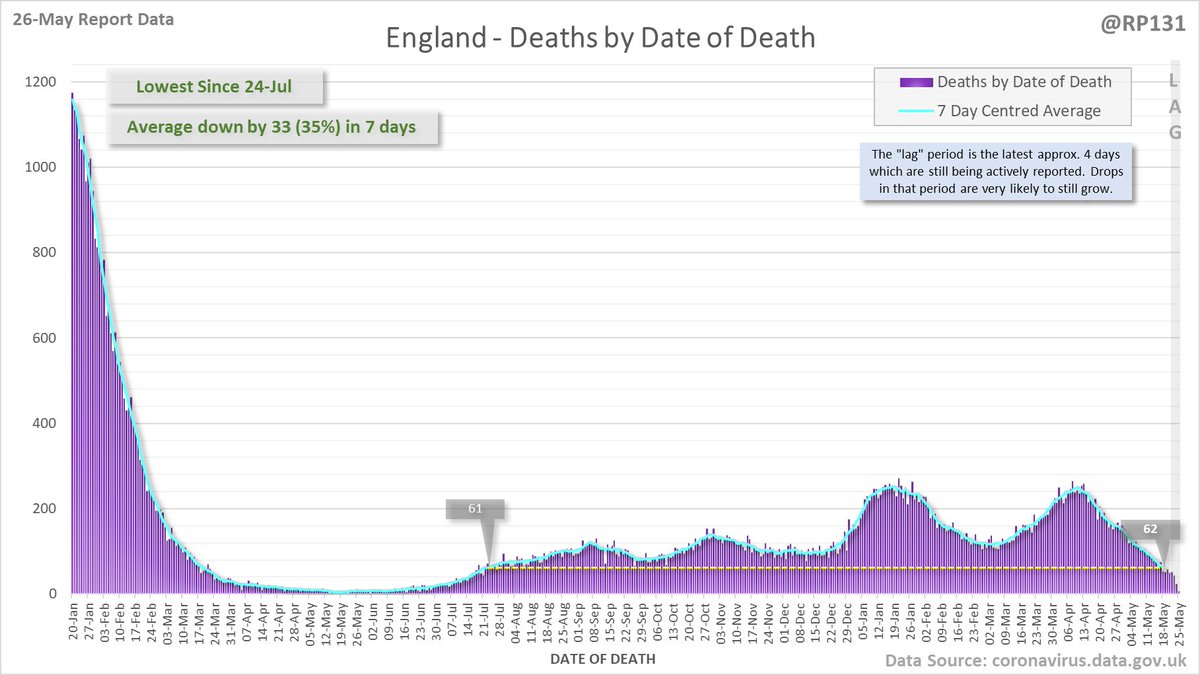
England date-of-death vs. announcement chart. Note that the numbers drop at the end as data is still being actively reported for those dates.
Pivot for 17-Jan to show breakdown of both 31 NHS and 32 (net) PHE deaths by date of death. The negatives are a combination of date of death corrections and accounting for NHS deaths that were already known to PHE. Small version for twitter first:
Chart form of today's dates of death for England (most of the noise earlier in the year is likely due to dataset merge errors and/or corrections).
England all settings age distribution chart.
Some of the more detailed content from this thread has been moved to an external page to try and make the twitter updates a bit more manageable. You can still see the full version here: …ddatashare.s3-eu-west-1.amazonaws.com/Deaths/Deaths_…

• • •

Missing some Tweet in this thread? You can try to force a refresh
 

Keep Current with Richard 📊📉

Richard 📊📉 Profile picture

Stay in touch and get notified when new unrolls are available from this author!

Read all threads

This Thread may be Removed Anytime!

PDF

Twitter may remove this content at anytime! Save it as PDF for later use!

Try unrolling a thread yourself!

how to unroll video
  1. Follow @ThreadReaderApp to mention us!

  2. From a Twitter thread mention us with a keyword "unroll"
@threadreaderapp unroll

Practice here first or read more on our help page!

More from @RP131

May 27, 2022
61 new #covid19uk deaths reported today (27-May). This brings the rolling average by date of death (allowing 4 days for lag) to 70, equivalent to around 21-Jul (i.e. 303 days ago), a reduction of 34 (33%) in the last week.
Closer look at the latest 45 days, with today's added numbers highlighted in orange. Individual nations and animated England charts further down the thread.
Longer term charts for England, Scotland, Wales and Northern Ireland.
Read 6 tweets
May 27, 2022
4,661 new #covid19uk positive tests reported today (27-May).

Overall England is DOWN 22% on previous Friday and day-1 lateral flow positives are also down by 19%.

England's rolling average by specimen date has now been dropping since the 21st of March (67 days ago).
Chart to show England positive tests (as of 27-May) by breakdown of first infection events and possible reinfection events.

Possible reinfections were added to the data from 31-Jan and the rolling average vs. total tests is currently about 17%.
Longer term view. 4,661 new #covid19uk positive tests reported today (27-May). This brings the rolling average by specimen date (allowing 4 days for lag) to 6,958, equivalent to around 08-Jun (i.e. 346 days ago), a reduction of 1268 (15%) in the last week.
Read 7 tweets
May 26, 2022
91 new #covid19uk deaths reported today (26-May). This brings the rolling average by date of death (allowing 4 days for lag) to 71, equivalent to around 24-Jul (i.e. 299 days ago), a reduction of 35 (33%) in the last week. Image
Closer look at the latest 45 days, with today's added numbers highlighted in orange. Individual nations and animated England charts further down the thread. Image
Longer term charts for England, Scotland, Wales and Northern Ireland. ImageImageImageImage
Read 6 tweets
May 26, 2022
8,369 new #covid19uk positive tests reported today (26-May).

Overall England is DOWN 21% on previous Thursday and day-1 lateral flow positives are also down by 16%.

England's rolling average by specimen date has now been dropping since the 21st of March (66 days ago). Image
Chart to show England positive tests (as of 26-May) by breakdown of first infection events and possible reinfection events.

Possible reinfections were added to the data from 31-Jan and the rolling average vs. total tests is currently about 17%. Image
Longer term view. 8,369 new #covid19uk positive tests reported today (26-May). This brings the rolling average by specimen date (allowing 4 days for lag) to 7,239, equivalent to around 09-Jun (i.e. 344 days ago), a reduction of 1145 (14%) in the last week. Image
Read 7 tweets

Did Thread Reader help you today?

Support us! We are indie developers!


This site is made by just two indie developers on a laptop doing marketing, support and development! Read more about the story.

Become a Premium Member ($3/month or $30/year) and get exclusive features!

Become Premium

Don't want to be a Premium member but still want to support us?

Make a small donation by buying us coffee ($5) or help with server cost ($10)

Donate via Paypal

Or Donate anonymously using crypto!

Ethereum

0xfe58350B80634f60Fa6Dc149a72b4DFbc17D341E copy

Bitcoin

3ATGMxNzCUFzxpMCHL5sWSt4DVtS8UqXpi copy

Thank you for your support!

Follow Us!

:(