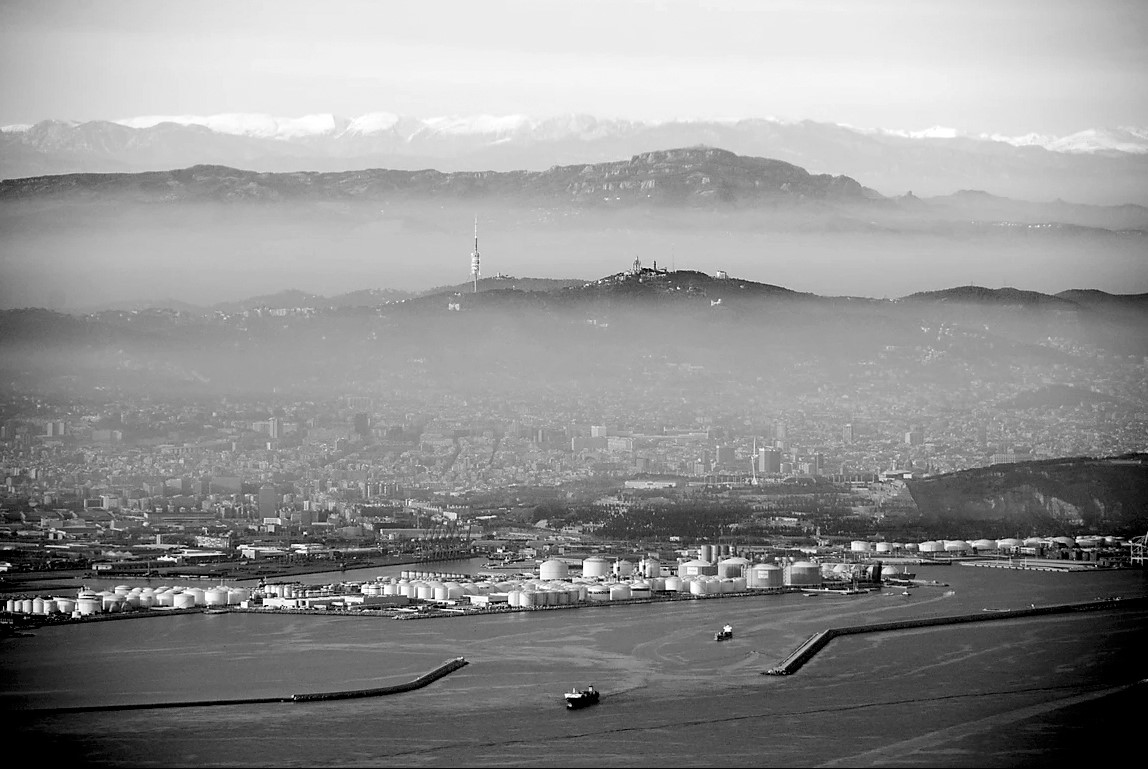
👉 6 years ago we made a map trying to explain the Ukraine's war with data. It was an exercise to discover if was possible to explain the conflict using public data from a diversity of sources: UN, OSM, Social Networks…
[1/12] datawar.300000.eu
With all this bunch of data we were able to talk about deaths and injuries, attacks and protests, but also about borders and identities, impact on media and political reactions.
[2/12]
All this maps were placed inside Spazio Ridotto (at @la_Biennale 2016) and published here to be shared with everyone.
[3/12]
Now, 6 years after, even if the digitization of our world has been growing constantly is not possible to reproduce all this maps.
[4/12]
We don’t have accessible social networks where we can get images documenting the attacks. Today Flickr use is minority and the other alternatives are not accessible.
[5/12]
Gdelt project (@gdeltproject) (database with al the media of the world), even if it’s alive, it’s not possible to be accessed easily (without a google bigquery account 🪙🪙🪙)
[6/12]
Redonbass has disappeared and it’s documentation of the destructions in the military attacks
[7/12]
Gar15 it’s not more updated (and they don’t have plans to do it…) risk.preventionweb.net
[8/12]
The UNOCHA reports are the same nightmare if you want to make a semantical analysis. They are provided in pdf… but now they provide also charts (png!!) and maps (png!!) CSV? -> NO!, TXT? -> NO!
[9/12]
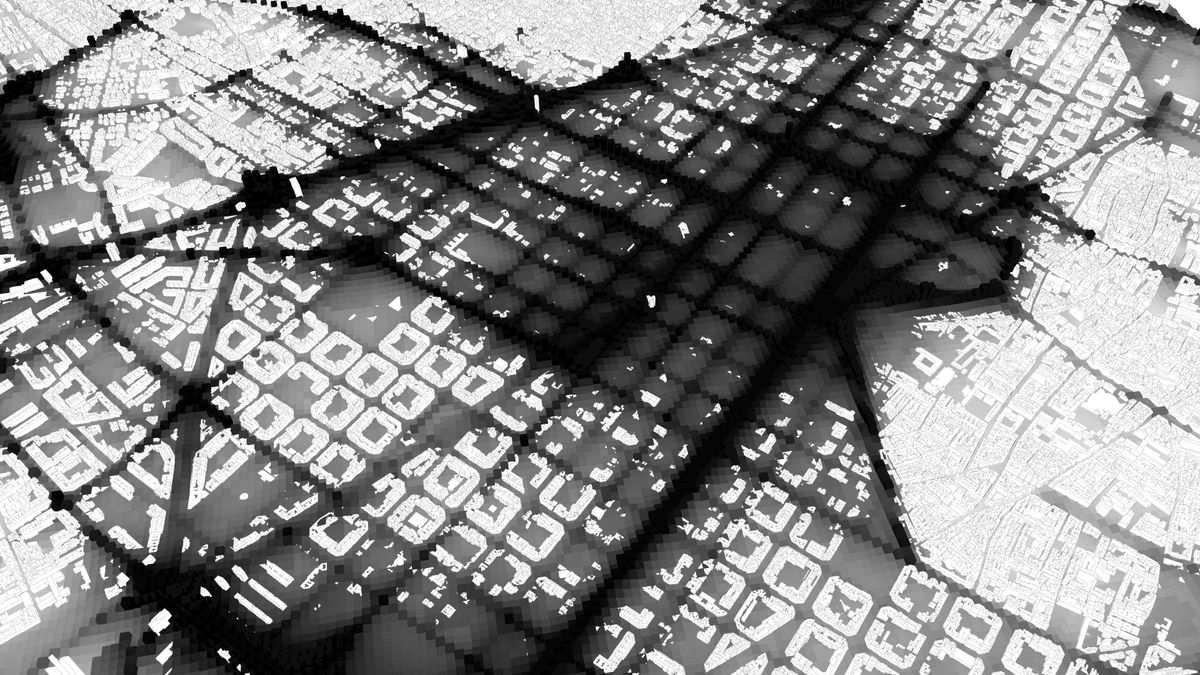
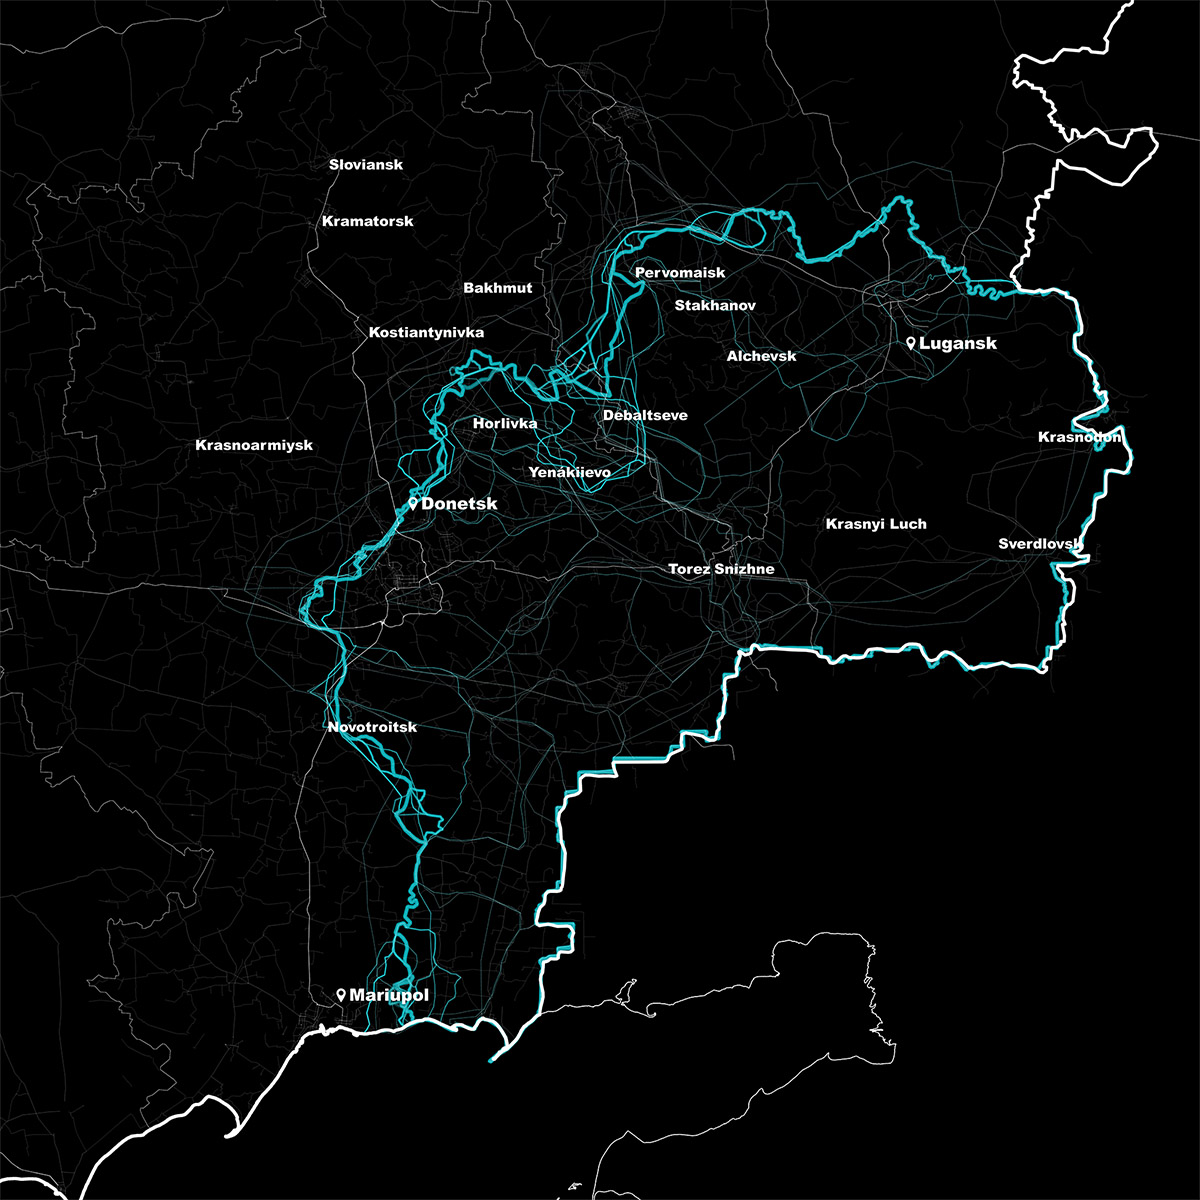
Fortunately OSM it’s an strong project with awesome data. Every day more precise and with more metadata associated to it’s geometries, with all the changes registered, with buildings and crops well documented.
[10/12]
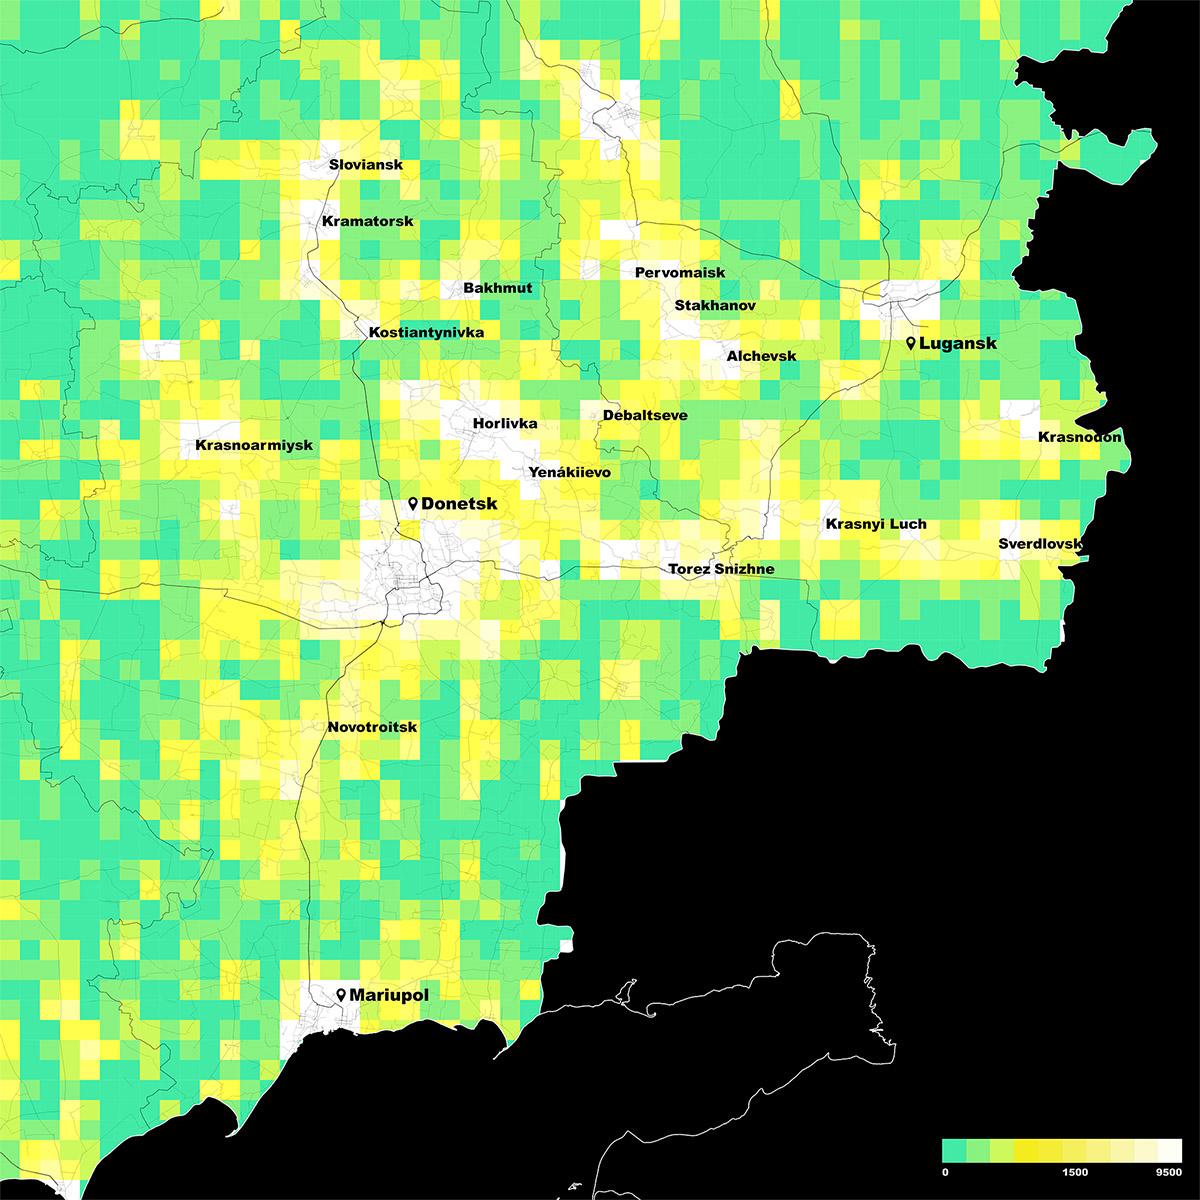
@Liveuamap it’s a great tool and working hard. Providing real time data from different sources about the activity of the injuries and attacks.
[11/12]
Understanding and measure the conflict today with data is highly more difficult than 6 years ago. Then…, what can we expect from this war today?
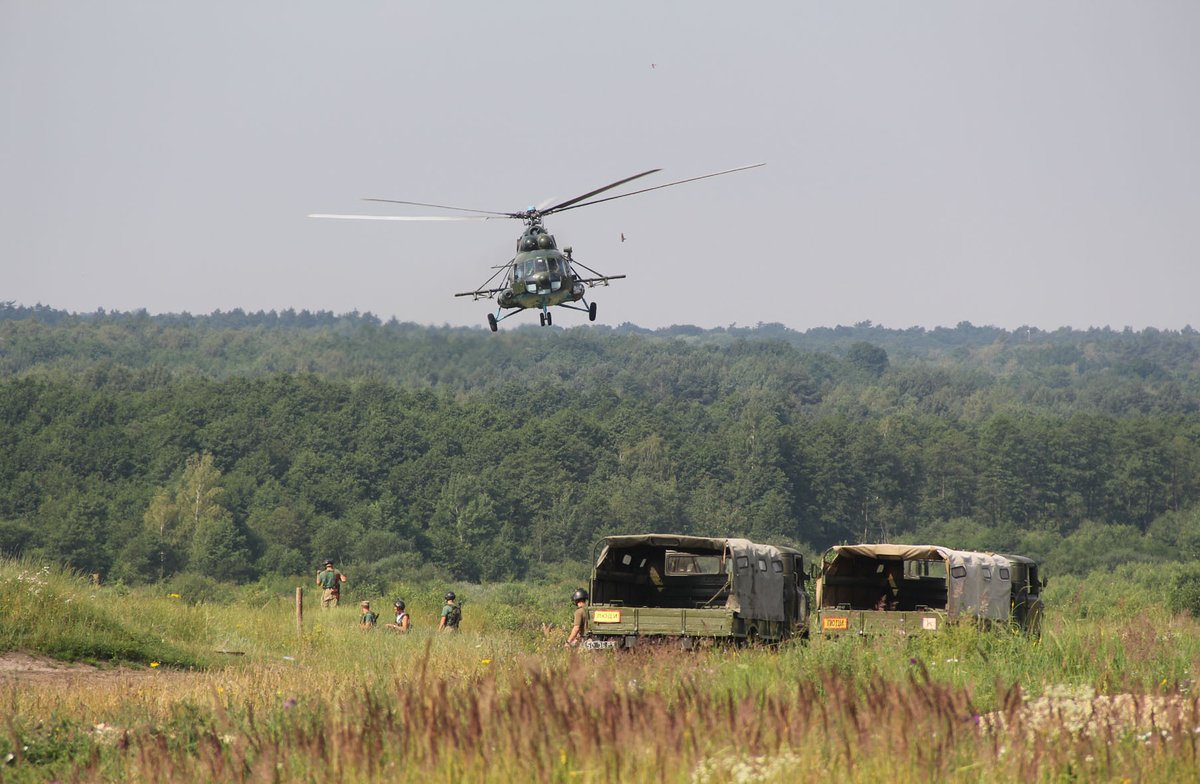
Of course, war is about bombs ans destruction. But above all about misinformation. datawar.300000.eu
[12/12]
• • •
Missing some Tweet in this thread? You can try to
force a refresh
Durante la COVID19 preparamos cartografías de Madrid que ayudasen a plantear estrategias en las que los procesos de confinamiento y desconfinamiento pudiesen realizarse según las distintas complejidades demográficas y los entornos urbanos en los que residen
🧵
// La población vulnerable
Dónde existe una mayor proporción de habitantes con edades inferiores a 15 años y mayores de 65 (según datos del padrón continuo del INE)
// Las viviendas
Dónde los tejidos urbanos acogen mayor proporción de usos residenciales (según datos del catastro)
The model develops a new calculation methodology through which spatial detail and the assessment of impacts on the population are improved. It's fueled with open data and creates a calculation system that places the citizen at the center of the model
@estelabo @CarpioPi @laiabonetrull @ealmirall @bacc_cat @ManelFerri @CarlosMorenoFr The model develops a new calculation methodology through which spatial detail and the assessment of impacts on the population are improved. It's fueled with open data and creates a calculation system that places the citizen at the center of the model
@estelabo @CarpioPi @laiabonetrull @ealmirall @bacc_cat @ManelFerri @CarlosMorenoFr As a result of this new methodology, a new collection of maps is presented, comprising more than 100 indicators and 12 synthetic clusters that describe, street by street, building by building, the proximity and capacity of all the facilities that the city provides to its citizens
El aire contaminado mata. Este ha sido exhalado como un privilegio individual a perjudicar la salud de los otros. Reivindicamos el derecho a respirar un aire limpio. Es a través del planeamiento urbano que podremos incidir en esta transformación.
HILO 👇
@IRLlull
Ha presentado parte de la investigación que hemos realizado para la participación de Cataluña a la #BiennaleArchitettura2021 . Hemos tenido la suerte de trabajar bajo el comisariado de @osubiros ,pero también….
L’aire contaminat mata. Aquest ha sigut exhalat com un privilegi individual a malmetre la salut dels altres, sobretot a la població més vulnerable. Reivindiquem el dret a respirar un aire net. És a través del planejament urbà que podrem incidir en aquesta transformació.
FIL 👇
@IRLlull ha presentat part de la recerca que hem realitzat per a la participació de Catalunya a la #BiennaleArchitettura2021
Hem tingut la sort de treballar sota el comissariat de @osubiros , però també….