
@unusual_whales now shows the historical volume and OI as well as the intraday bid and ask-side volume on chains themselves.
Coupling that with the saving trades feature, you can now track positions from entry to exit with a few clicks each day.
Here's how:
Coupling that with the saving trades feature, you can now track positions from entry to exit with a few clicks each day.
Here's how:
1. Click on the heart to save your trade. 

2. Click "View saved trades" to view your saved trades. You can keep many trades here to keep an eye on throughout the day or over many days.
Your saved trades will appear here.
(Don't forget to click "Back to Flow" to view the flow again.)
Your saved trades will appear here.
(Don't forget to click "Back to Flow" to view the flow again.)


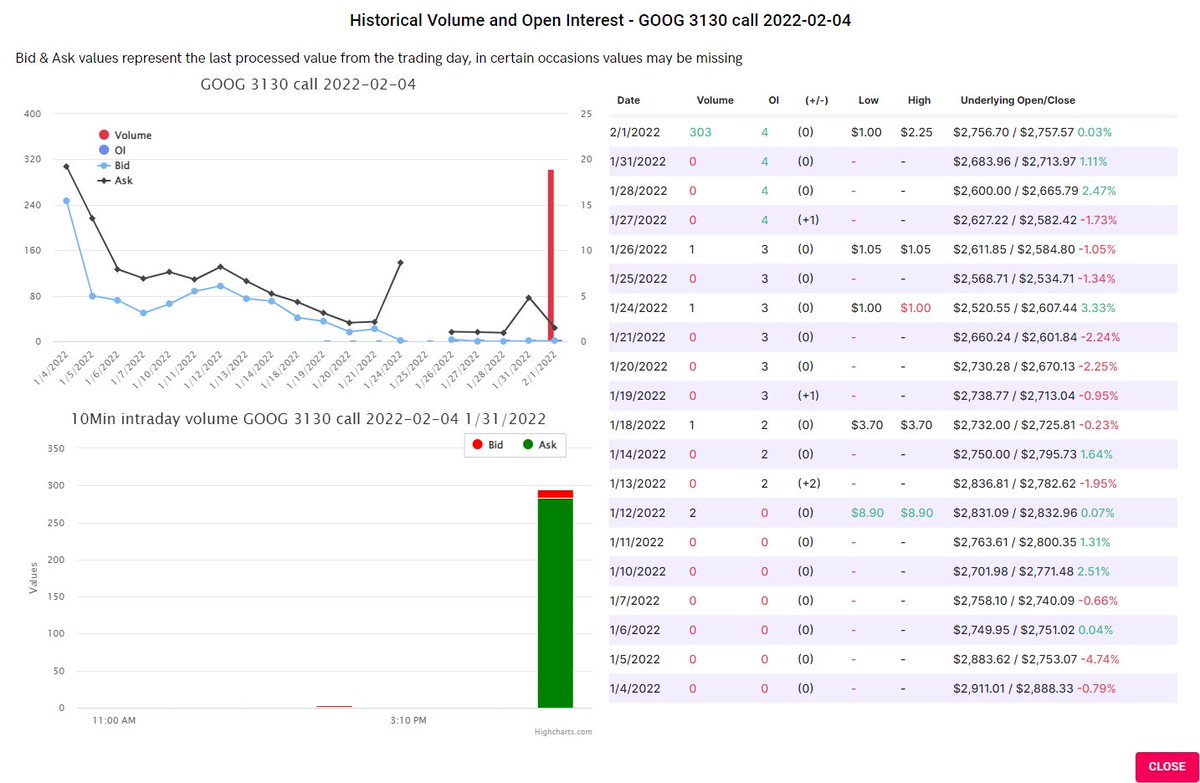
Click on the contract's expiration date to open up the chain's historical volume and OI, as well as intraday bid-ask.
OI can be a powerful tool in understanding if traders are still in positions to help you build your own theses.
Read more on OI here:
OI can be a powerful tool in understanding if traders are still in positions to help you build your own theses.
Read more on OI here:
https://twitter.com/Crowd_Traders/status/1483990507722362880

Do this for all of the trades you are tracking before market open to determine if OI changed in the positive or negative from the day you entered.
If OI went down or stayed about the same, you know the trader DID NOT stay in, so you need to consider that for your own positions.
If OI went down or stayed about the same, you know the trader DID NOT stay in, so you need to consider that for your own positions.

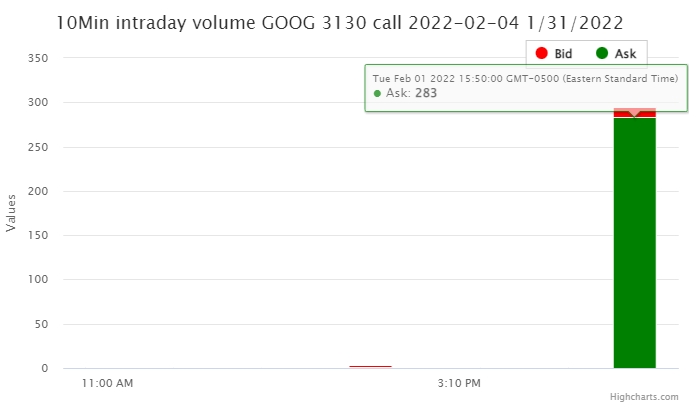
Then on the bottom left of that panel, there is a chart for intraday volume--the volume throughout the day staggered into 10 minute blocks--and whether it was bid-side or ask-side. This reveals if and when traders are exiting the positions!
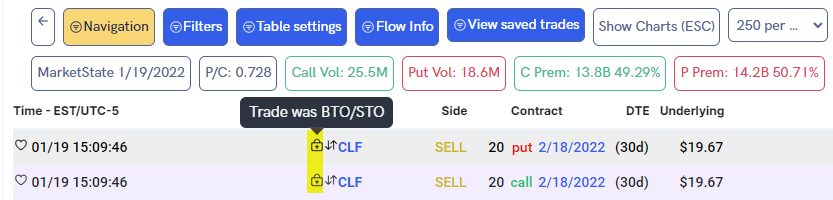
Here is how to know if a trader was OPENING a position:
In the flow, trades appended with 💼 can be intuited as bought or sold to open. This determination is made if the size of the trade was greater than the chain's OI.
(Trades *without* 💼 could have still been BTO/STO!)
In the flow, trades appended with 💼 can be intuited as bought or sold to open. This determination is made if the size of the trade was greater than the chain's OI.
(Trades *without* 💼 could have still been BTO/STO!)
Therefore, if you are seeing volume up to *but not greater than* the OI from the trade you first tracked, you might take a look at the overall flow and find if traders are now exiting, so you can make a decision for your own positions, too!
You can do this every morning before market open to speculate whether the position is still "alive", so to speak, to give you a particular edge in tailing the most unusual or sizeable orders.
Read more about how to find unusual activity here, by the way:
Read more about how to find unusual activity here, by the way:
https://twitter.com/Crowd_Traders/status/1479818412331257863
As always, let me know if this helped! Thank you very much for your support and eagerness to learn.
I would love to be able to continue to teach--so please keep asking great questions so we can figure out a winning strategy together!
I would love to be able to continue to teach--so please keep asking great questions so we can figure out a winning strategy together!
@threadreaderapp unroll
• • •
Missing some Tweet in this thread? You can try to
force a refresh


