1. An update on #flu in the US, with data from @CDCgov for the week ending Jan 29.
For the second year in a row the warnings of a "twindemic" of Covid & flu haven't come to pass. There will be winters when we have to deal with both. But this year we may have dodged that bullet.
2. Currently influenza-like activity is "below baseline." That could mean we've passed the peak of flu season for winter 2021-22. That said, #flu B activity often occurs late in the season β sometimes into March & April. So there could be more flu later.
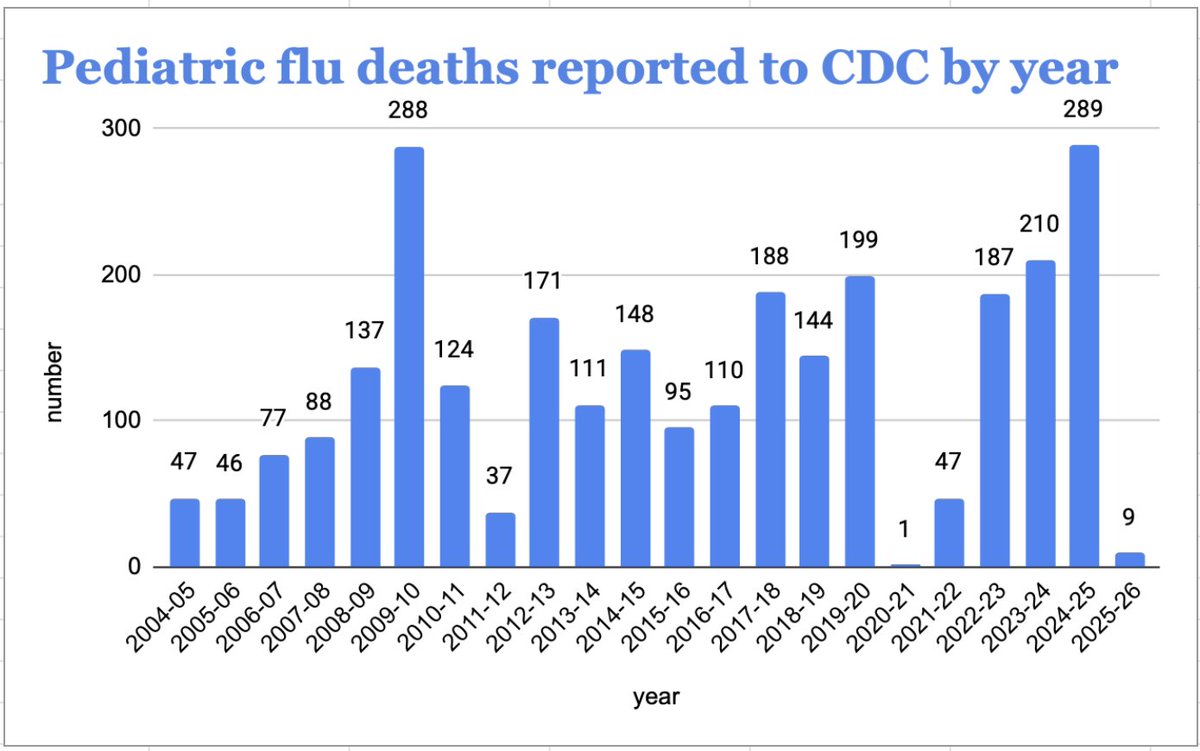
3. @CDCgov estimates that 1,200 people have died from #flu this winter in the US. And it has received reports of 5 deaths of children. In most regular years, there are somewhere between 100 and 200 children who die from flu.
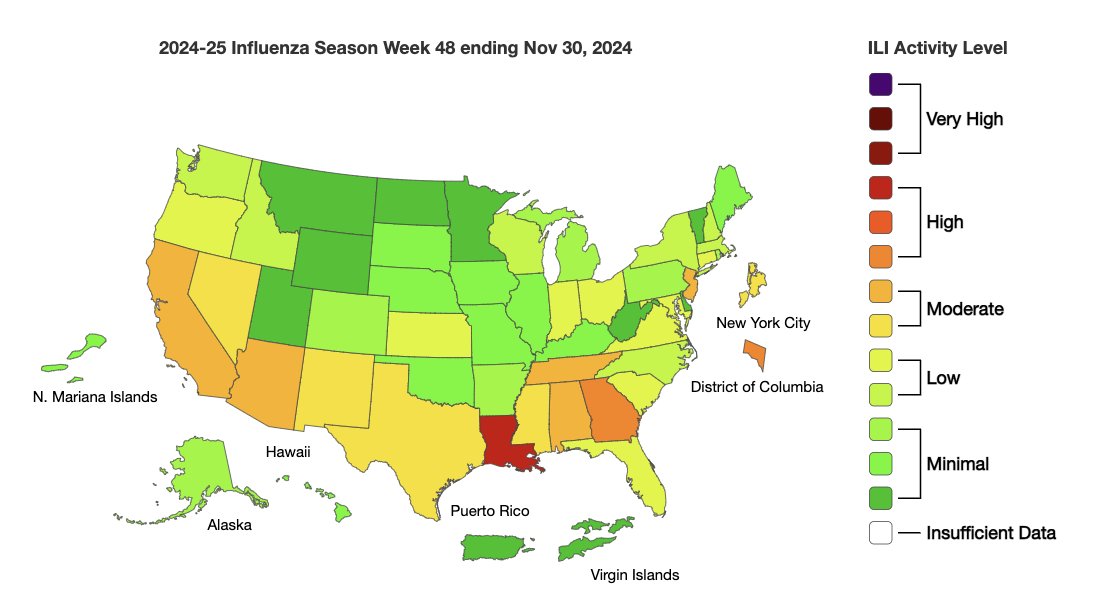
4. It looks like (non-Covid) influenza-like illness activity in the US peaked the week ending Jan. 1 (left). Activity since then has eased. This is really early for the ILI map to have this much green in it.
5. The burden of #flu this year is really mild vis-a-vis regular years, as this graph on cumulative hospitalizations shows. This year hasn't been that much different from last year (when there really wasn't a flu season) or the 2015-16 season, which was unusually mild.
1. Some thoughts on #H5N1 #birdflu in cows. A π§΅
A bunch of new herds were announced by a couple of states today βΒ Colorado and Iowa. The former reported +5 & looks like it may have another pending; It now has 18 in total, maybe 19. Iowa reported 2 more, taking it to 10.
2. To the best of my ability to keep up βΒ and that's being challenged β I think there have been 125 herds reported in 12 states since the end of March. This graph combines @USDA's numbers from yesterday with the newly reported herds from Colorado & Iowa.
3. But @USDA threw a wrench into the works today. It updated its exceedingly wonky #H5N1 #birdflu in cows landing site. Some things work better, but the cumulative number of herds was lowered by 4 (from yday) with no explanation. USDA now says 112 herds in 12 states.
1. @USDA posted an FAQ today about the federal order restricting movement of dairy cattle infected with
#H5N1 #birdflu. Interesting information therein.
A π§΅
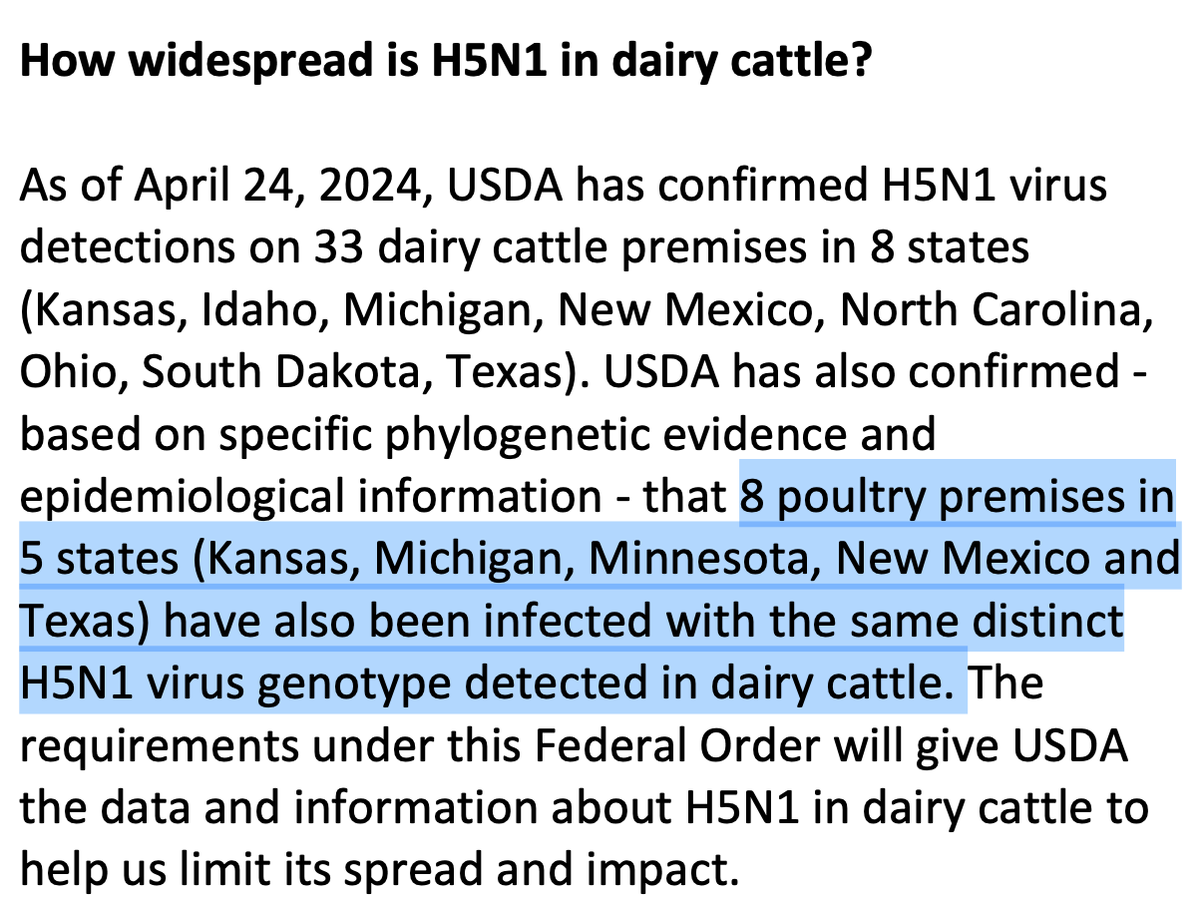
New to me: USDA says 8 poultry operations in 5 states have had poultry outbreaks with the virus detected in cows.
2. Minnesota hasn't reported #H5N1 #birdflu in cattle, but it has had at least 1 poultry outbreak with the cattle virus, @USDA reveals. More evidence, probably, that the virus is far more widely spread than has been realized. The FAQ is here: aphis.usda.gov/sites/default/β¦
3. The federal order on the movement of dairy cows goes into effect 4/29. @USDA is setting what looks like an ambitious timeline for processing of tests, especially "non-negative" tests that must then go for confirmatory testing at the USDA lab in Ames, Iowa. #H5N1 #birdflu
1. Listening to an @ASTHO - @IDSAInfo - @CSTEnews webinar on #H5N1 #birdflu in cows.
Of interest so far:
β @USDA is monitoring feral swine; no detections of H5 so far.
β in the "small number" of samples tested to date, doesn't look like cows are shedding virus thru feces.
2. @USDA Rosemary Sifford said the infections are "mostly" being seen in lactating herds.
1 herd was found to be positive despite the fact there were no clinical signs among the cows.
Sifford said USDA doesn't yet know how long infected cows shed virus.
#H5N1 #birdflu
@USDA 3. Sonja Olsen from @CDC says there've been 6 infections detected in cats on dairy farms. Not sure I've seen the exact number. #H5N1 #BirdFlu
1. A 𧡠on #flu, #Covid & #RSV (mostly flu). The
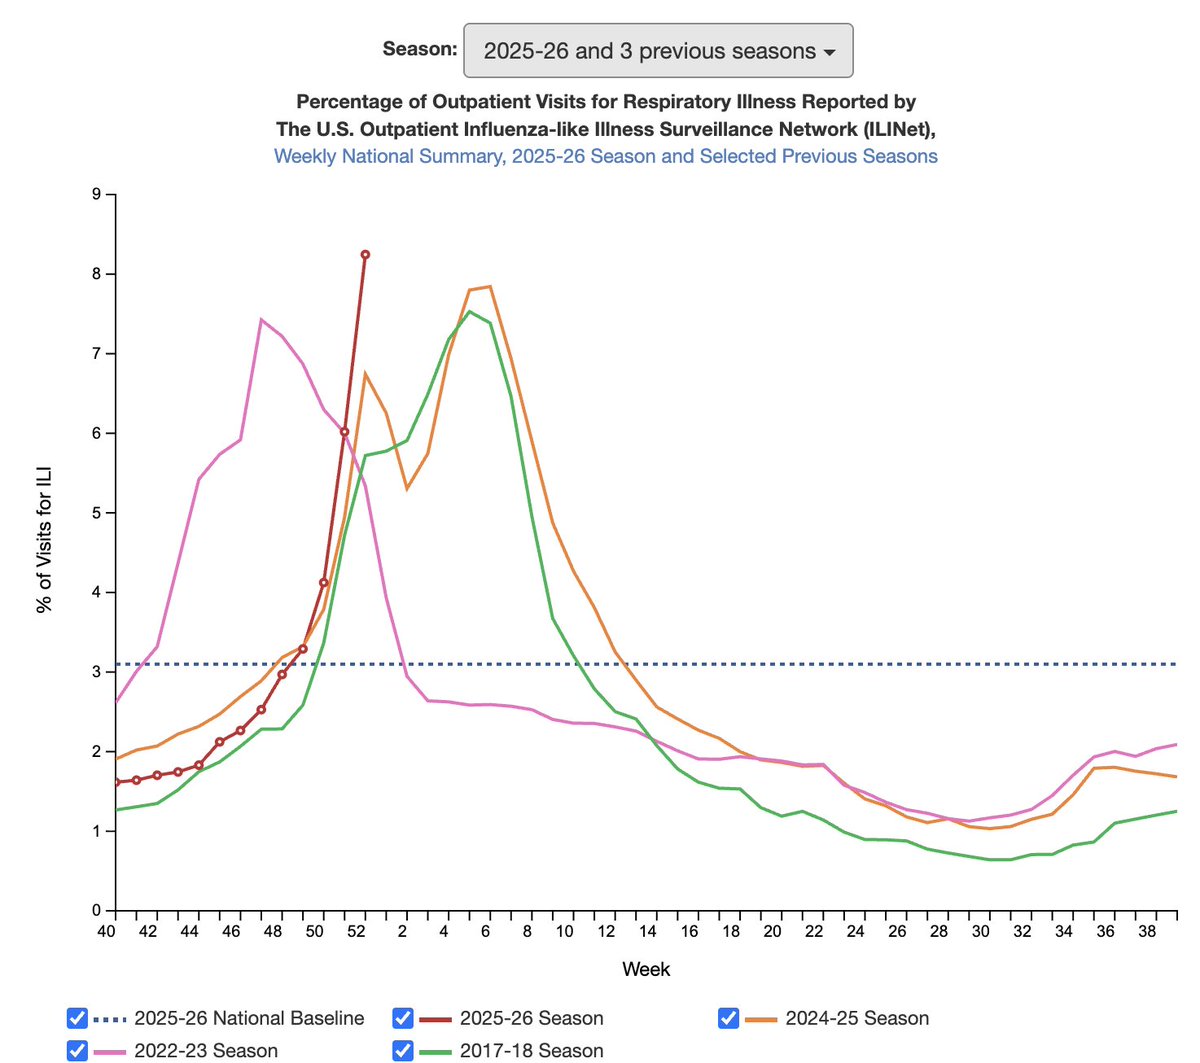
#influenza-like illness season is pretty much over. The percentage of people seeking care for ILIs is below 2.9%, that dotted line. You can catch flu at any time of the year, but chances of catching it now thru the summer are low.
2. It's not just #flu. #Covid activity now is at low levels nationally and #RSV activity has declined to the point where @CDCgov says the season is ending. Hallelujah. cdc.gov/respiratory-viβ¦
3. It hasn't been a particularly bad #flu season, but the estimated number of hospitalizations for flu has been pretty high β one of the highest in recent years. (red line) The 2017-18 season, which was harsh, was worse. CDC estimates there were 370K hospitalizations this year.
1. A π§΅on #flu & #Covid activity trends based on reports today from @CDCgov. Most of the data is for the week ending Feb. 3. The #influenza-like illness (ILI) season seems to have peaked at the end of Dec, with declines in flu, Covid & #RSV since then. But the season isn't over.
2. There was a bit of an uptick in #flu activity in the central & south central US. It corresponds with an increase in flu B detections there. Pre-Covid, flu B often arrived in a late season wave. We may see that again this year.
Map on left is the week ending 1/27; right is 2/3.
3. An additional 8 pediatric #flu deaths were reported to @CDCgov in the wk ending 2/3. The season's death toll in kids now stands at 74, which is awful, obviously, but not as bad as most years pre-Covid. But if there's a lot of flu B activity, this number could climb.
1. Traditionally I've done #flu updates on Fridays, but given our new reality β #Covid is here to stay β & the expansion of data on @CDCgov's website, I'm going to broaden the scope going forward. Top line news: Lotta illness out there right now. cdc.gov/respiratory-viβ¦
2. Most parts of the country are ensconced in #influenza-like illness season right now. (Minn, what are you doing to stay so healthy?) This graphic doesn't just represent #flu activity; #Covid, #RSV & other ILIs are also captured here. @CDCgov's FluView: cdc.gov/flu/weekly/
3. #Flu is the most common bug making people sick right now, but there's a lot of #Covid going around too. (I know from recent experience.) #RSV is still fairly active but declining. This breakdown of what's causing most illness is seen both in positive tests & ER visits.