1/
Get a cup of coffee.
In this thread, I'll show you how to read and understand a company's Balance Sheet.
As investors, we should be able to judge businesses by looking at their financial statements.
And the Balance Sheet, of course, is 1 of 3 key financial statements:
Get a cup of coffee.
In this thread, I'll show you how to read and understand a company's Balance Sheet.
As investors, we should be able to judge businesses by looking at their financial statements.
And the Balance Sheet, of course, is 1 of 3 key financial statements:

2/
Imagine that Alice and Bob are neighbors.
Alice owns and operates a "candles" business.
She makes candles in her loft, which she's converted into a lab of sorts.
She then takes the candles to a local home goods store, which sells them and pays her at the end of each month.
Imagine that Alice and Bob are neighbors.
Alice owns and operates a "candles" business.
She makes candles in her loft, which she's converted into a lab of sorts.
She then takes the candles to a local home goods store, which sells them and pays her at the end of each month.
3/
Suppose it costs Alice $10 to make a candle. This is the cost of the candle's glass case, wax, wick, etc.
And suppose the home goods store pays Alice $15/candle, and sells 1460 of her candles every month.
Then, Alice would make ~$87.6K/year. Here's her Income Statement:
Suppose it costs Alice $10 to make a candle. This is the cost of the candle's glass case, wax, wick, etc.
And suppose the home goods store pays Alice $15/candle, and sells 1460 of her candles every month.
Then, Alice would make ~$87.6K/year. Here's her Income Statement:

4/
Let's now turn to Bob, Alice's neighbor.
Bob owns and runs a "burrito" business.
Each morning, he makes 120 burritos. He takes these burritos to a busy street corner at lunch time, and sells them.
On the way back home, he buys groceries to make the next day's burritos.
Let's now turn to Bob, Alice's neighbor.
Bob owns and runs a "burrito" business.
Each morning, he makes 120 burritos. He takes these burritos to a busy street corner at lunch time, and sells them.
On the way back home, he buys groceries to make the next day's burritos.
5/
Suppose it costs Bob $4 to make a burrito. This is the cost of the tortilla, the rice, the beans, etc.
And suppose Bob sells his burritos for $6 apiece.
Then, Bob would also make $87.6K/year.
Here's *his* Income Statement:
Suppose it costs Bob $4 to make a burrito. This is the cost of the tortilla, the rice, the beans, etc.
And suppose Bob sells his burritos for $6 apiece.
Then, Bob would also make $87.6K/year.
Here's *his* Income Statement:

6/
Of course, these models are *highly* simplified.
Both Alice and Bob probably have several other costs -- insurance, permits, taxes, etc.
But to learn key concepts, it's useful to study such "bare bones" examples -- stripped of all extraneous details.
So, stick with me!
Of course, these models are *highly* simplified.
Both Alice and Bob probably have several other costs -- insurance, permits, taxes, etc.
But to learn key concepts, it's useful to study such "bare bones" examples -- stripped of all extraneous details.
So, stick with me!
7/
Here's a question.
Whose business is "better": Alice's or Bob's?
As we've seen above, both businesses have *exactly* the same annual Revenues ($262.8K), Costs ($175.2K), Profits ($87.6K), and Margins (~33.33%).
So, economically speaking, aren't these businesses identical?
Here's a question.
Whose business is "better": Alice's or Bob's?
As we've seen above, both businesses have *exactly* the same annual Revenues ($262.8K), Costs ($175.2K), Profits ($87.6K), and Margins (~33.33%).
So, economically speaking, aren't these businesses identical?
8/
The answer is NO.
Why?
Because, even though these businesses produce identical *earnings* for their owners each year, they require different amounts of *capital* to do so.
That is, these businesses have identical Income Statements. But very different *Balance Sheets*.
The answer is NO.
Why?
Because, even though these businesses produce identical *earnings* for their owners each year, they require different amounts of *capital* to do so.
That is, these businesses have identical Income Statements. But very different *Balance Sheets*.
9/
For example, Alice's business requires her to invest $10/candle * 1460 candles = $14.6K of capital into it at the outset.
Once she *puts in* this $14.6K to make her candles, she gets to *take out* $7.3K/month ($87.6K/year) from the business ($5 profit/candle * 1460 candles).
For example, Alice's business requires her to invest $10/candle * 1460 candles = $14.6K of capital into it at the outset.
Once she *puts in* this $14.6K to make her candles, she gets to *take out* $7.3K/month ($87.6K/year) from the business ($5 profit/candle * 1460 candles).
10/
What about Bob?
Well, following the same logic, Bob only needs to *put in* $480 of capital ($4/burrito * 120 burritos).
And once he does that, he gets to *take out* $240 *daily* ($2 profit/burrito * 120 burritos) -- which adds up to $87.6K over a year.
What about Bob?
Well, following the same logic, Bob only needs to *put in* $480 of capital ($4/burrito * 120 burritos).
And once he does that, he gets to *take out* $240 *daily* ($2 profit/burrito * 120 burritos) -- which adds up to $87.6K over a year.
11/
Clearly, Bob's is the "better" business.
First, it requires *less* capital ($480 vs Alice's $14.6K) to produce the *same* annual earnings ($87.6K).
Second, it *turns* this capital *daily* vs Alice's *monthly* -- allowing Bob to take out $240/day vs Alice's $7.3K/month.
Clearly, Bob's is the "better" business.
First, it requires *less* capital ($480 vs Alice's $14.6K) to produce the *same* annual earnings ($87.6K).
Second, it *turns* this capital *daily* vs Alice's *monthly* -- allowing Bob to take out $240/day vs Alice's $7.3K/month.
12/
That's why it's important to study ALL the financial statements of a business -- not just its Income Statement.
In particular, studying the *Assets* side of the *Balance Sheet* tells us how much capital a business needs to conduct its operations.
That's why it's important to study ALL the financial statements of a business -- not just its Income Statement.
In particular, studying the *Assets* side of the *Balance Sheet* tells us how much capital a business needs to conduct its operations.
13/
Here's the *Assets* side of Alice's balance sheet, as her business cycles through various states.
As we can see, the Assets on this Balance Sheet NEVER drop below $14.6K -- the *minimum* amount of capital this business needs to function.
Here's the *Assets* side of Alice's balance sheet, as her business cycles through various states.
As we can see, the Assets on this Balance Sheet NEVER drop below $14.6K -- the *minimum* amount of capital this business needs to function.

14/
Compare that to the Assets on Bob's Balance Sheet, and we immediately see that Bob's business requires only $480 to function -- very modest compared to Alice's $14.6K.
High quality businesses require only a small amount of *assets* per dollar of *earnings* produced.
Compare that to the Assets on Bob's Balance Sheet, and we immediately see that Bob's business requires only $480 to function -- very modest compared to Alice's $14.6K.
High quality businesses require only a small amount of *assets* per dollar of *earnings* produced.

15/
Alice's and Bob's businesses are both "simple". They only need "working capital" assets -- cash, receivables, and inventory.
In addition to these, real world businesses typically also need fixed assets (eg, property, plant, and equipment), goodwill, intangibles, etc.
Alice's and Bob's businesses are both "simple". They only need "working capital" assets -- cash, receivables, and inventory.
In addition to these, real world businesses typically also need fixed assets (eg, property, plant, and equipment), goodwill, intangibles, etc.
16/
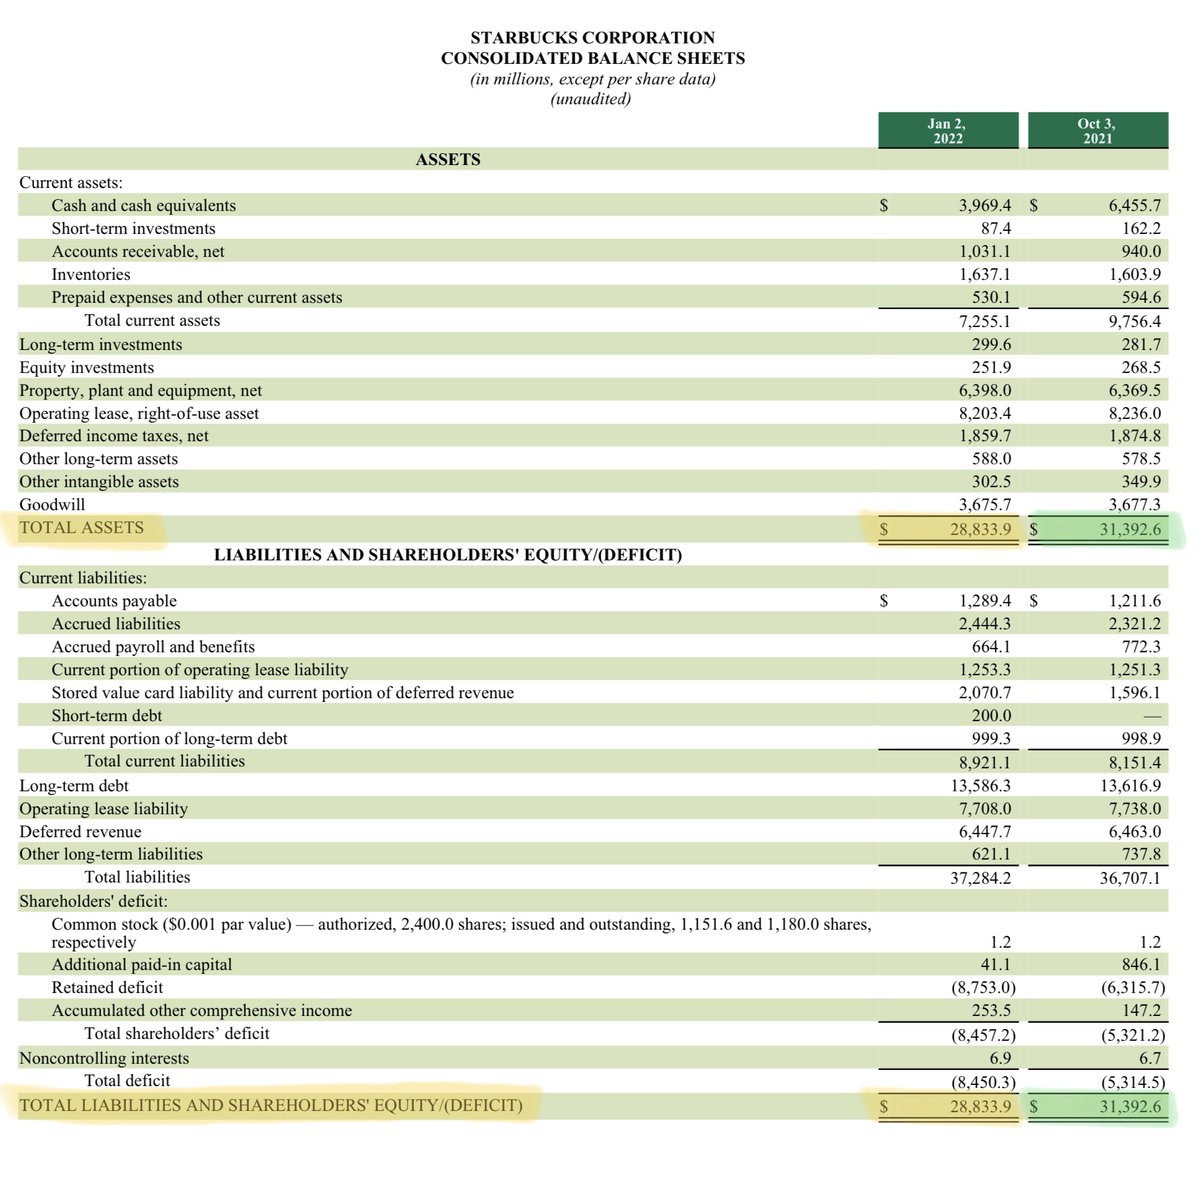
For example, here are the Assets listed on Home Depot's and Starbucks's Balance Sheets (which I took from their latest 10-Qs).
These Asset sections have more line items. But the fundamental principles are still the same as Alice's and Bob's simple businesses.
For example, here are the Assets listed on Home Depot's and Starbucks's Balance Sheets (which I took from their latest 10-Qs).
These Asset sections have more line items. But the fundamental principles are still the same as Alice's and Bob's simple businesses.


17/
So, that's the *Assets* side of the Balance Sheet. It tells us how much capital a business needs (and has) to function.
Every Balance Sheet also has a *Liabilities* side. This tells us *where* all this capital in the business *comes from*.
So, that's the *Assets* side of the Balance Sheet. It tells us how much capital a business needs (and has) to function.
Every Balance Sheet also has a *Liabilities* side. This tells us *where* all this capital in the business *comes from*.
18/
There are 3 main "sources" of capital in a business: Equity, Debt, and Float.
Equity is capital *put up* by the business's owners.
Debt is capital *borrowed* by the business -- on which it typically pays interest.
There are 3 main "sources" of capital in a business: Equity, Debt, and Float.
Equity is capital *put up* by the business's owners.
Debt is capital *borrowed* by the business -- on which it typically pays interest.
19/
And Float is capital that various parties (eg, suppliers, customers, employees, the government, etc.) have provided to the business -- typically for free.
For example, a supplier may sell raw materials to the business on credit. A customer may pre-pay for an order. Etc.
And Float is capital that various parties (eg, suppliers, customers, employees, the government, etc.) have provided to the business -- typically for free.
For example, a supplier may sell raw materials to the business on credit. A customer may pre-pay for an order. Etc.

20/
So, that's what the Liabilities side of the Balance Sheet does. It breaks down the capital in the business by *source* -- into Equity, Debt, and Float.
For example, here's how the Liabilities listed on Home Depot's and Starbucks's Balance Sheets break down:
So, that's what the Liabilities side of the Balance Sheet does. It breaks down the capital in the business by *source* -- into Equity, Debt, and Float.
For example, here's how the Liabilities listed on Home Depot's and Starbucks's Balance Sheets break down:


21/
And because the *Assets* and the *Liabilities* sides of the Balance Sheet are just two different ways of slicing and dicing the *same* capital, they both have to add up to the same total.
In other words, the Balance Sheet has to "balance". Duh!
And because the *Assets* and the *Liabilities* sides of the Balance Sheet are just two different ways of slicing and dicing the *same* capital, they both have to add up to the same total.
In other words, the Balance Sheet has to "balance". Duh!

22/
So, why should we study the Liabilities side?
After all, $1 of capital is $1 of capital, right? Why do we care whether it's Equity, Debt, or Float?
The answer is: businesses can boost returns for their owners by deploying someone else's capital for the owners' benefit.
So, why should we study the Liabilities side?
After all, $1 of capital is $1 of capital, right? Why do we care whether it's Equity, Debt, or Float?
The answer is: businesses can boost returns for their owners by deploying someone else's capital for the owners' benefit.
23/
For example, suppose Alice made a deal with her suppliers that she'd pay them *after* she herself got paid by the home goods store.
Then, she wouldn't need to put up $14.6K of her own money. She could put up $0, and still take out $87.6K per year!
For example, suppose Alice made a deal with her suppliers that she'd pay them *after* she herself got paid by the home goods store.
Then, she wouldn't need to put up $14.6K of her own money. She could put up $0, and still take out $87.6K per year!

24/
That's the power of Float.
It's essentially *free money* that can transform ordinary businesses into extraordinary ones.
No wonder Warren Buffett is such a big fan!
From his 2009 letter:
That's the power of Float.
It's essentially *free money* that can transform ordinary businesses into extraordinary ones.
No wonder Warren Buffett is such a big fan!
From his 2009 letter:

25/
And it's not just Float that provides this kind of "leverage".
The other non-Equity source of capital -- Debt -- can do so too. But Debt can also increase risk and make a business fragile -- usually to a larger extent than Float.
For more:
And it's not just Float that provides this kind of "leverage".
The other non-Equity source of capital -- Debt -- can do so too. But Debt can also increase risk and make a business fragile -- usually to a larger extent than Float.
For more:
https://twitter.com/10kdiver/status/1380942728222011395
26/
Please join me tomorrow (Sun, Feb 06) at 1pm ET for a new Money Concepts episode to discuss all things Balance Sheet.
Hope to see you there!
Link: callin.com/link/qmdxVokwNO
Please join me tomorrow (Sun, Feb 06) at 1pm ET for a new Money Concepts episode to discuss all things Balance Sheet.
Hope to see you there!
Link: callin.com/link/qmdxVokwNO
27/
About Money Concepts
We're a virtual investing club. Our goal is to help each other become better investors.
We meet Sundays at 1pm ET via @getcallin, to discuss all things investing.
Join us. Get the app. Subscribe. Tell your friends.
It's FREE.
callin.com/show/money-con…
About Money Concepts
We're a virtual investing club. Our goal is to help each other become better investors.
We meet Sundays at 1pm ET via @getcallin, to discuss all things investing.
Join us. Get the app. Subscribe. Tell your friends.
It's FREE.
callin.com/show/money-con…
28/
The Balance Sheet is such a key statement. I hope this thread showed you both *why* and *how* to read one.
If you're still with me, thank you very much! You're an Asset to my Twitter experience, and for that I'm in your Debt.
Please stay safe. Enjoy your weekend!
/End
The Balance Sheet is such a key statement. I hope this thread showed you both *why* and *how* to read one.
If you're still with me, thank you very much! You're an Asset to my Twitter experience, and for that I'm in your Debt.
Please stay safe. Enjoy your weekend!
/End
• • •
Missing some Tweet in this thread? You can try to
force a refresh