8 Chart Patterns by William O'Neil
Let's break them down one by one🧵
Let's break them down one by one🧵

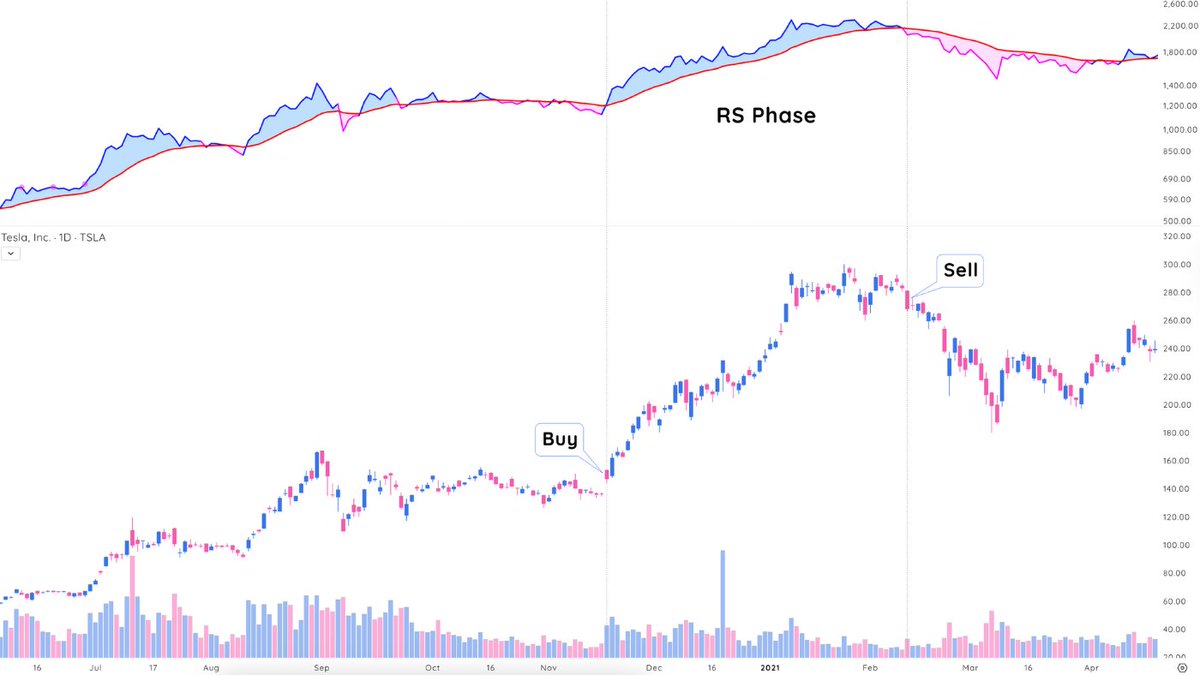
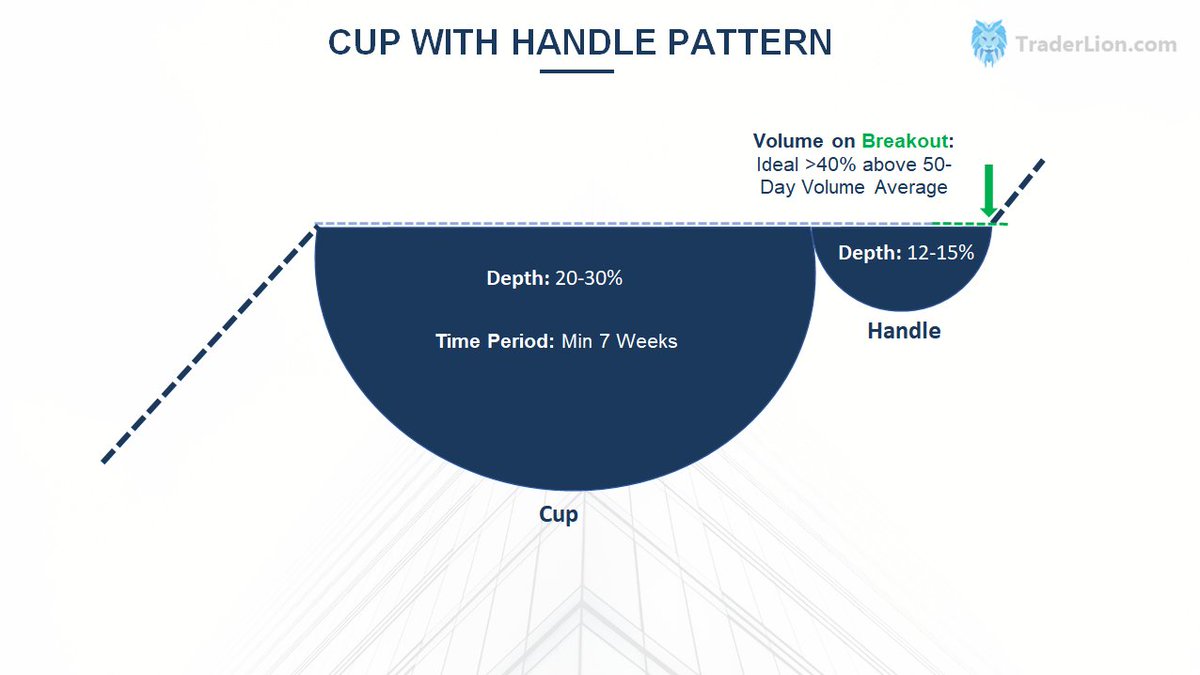
Perhaps the most famous basing pattern found in the market is the Cup with Handle pattern.
✅ Chart resembles a cup with a handle
✅ Base length: Minimum 7 weeks
✅ Base depth: 20-30%
✅ Buy point: high of the handle
✅ Handle length: 1 week
✅ Handle depth: no more than 15%
✅ Chart resembles a cup with a handle
✅ Base length: Minimum 7 weeks
✅ Base depth: 20-30%
✅ Buy point: high of the handle
✅ Handle length: 1 week
✅ Handle depth: no more than 15%

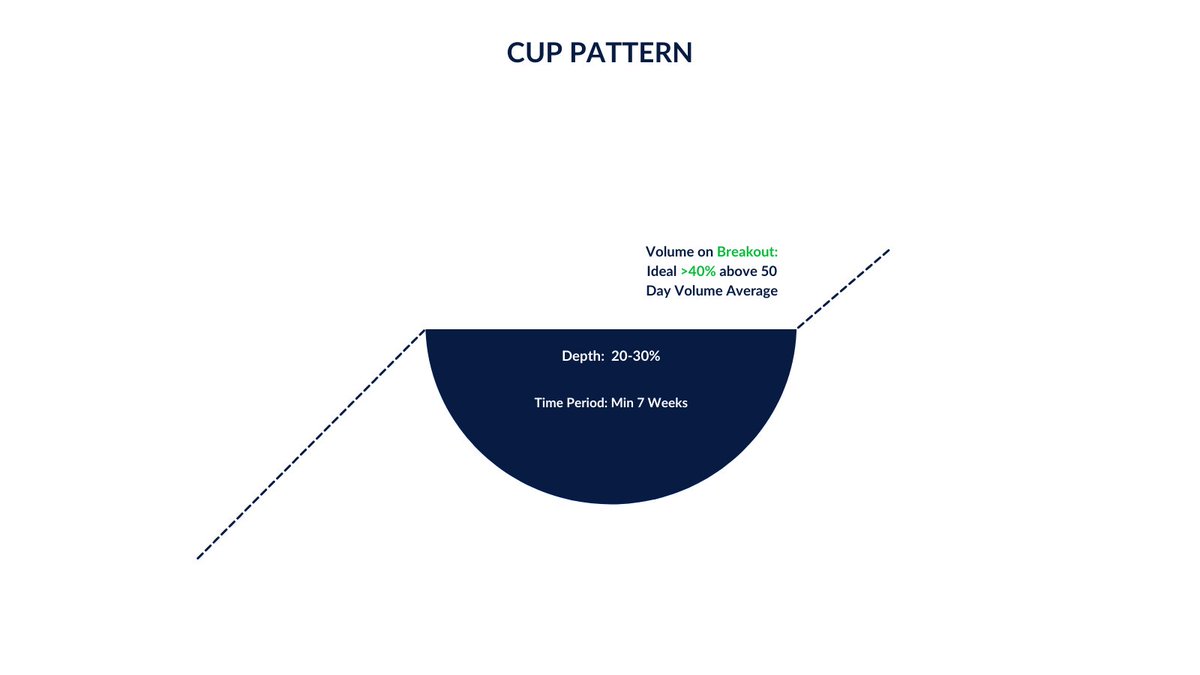
There is also a Cup without Handle pattern.
✅ Chart is just a cup, no handle
✅ Base length: Minimum 7 weeks
✅ Base depth: 20-30%
✅ Buy point: High of left side of cup
✅ Chart is just a cup, no handle
✅ Base length: Minimum 7 weeks
✅ Base depth: 20-30%
✅ Buy point: High of left side of cup

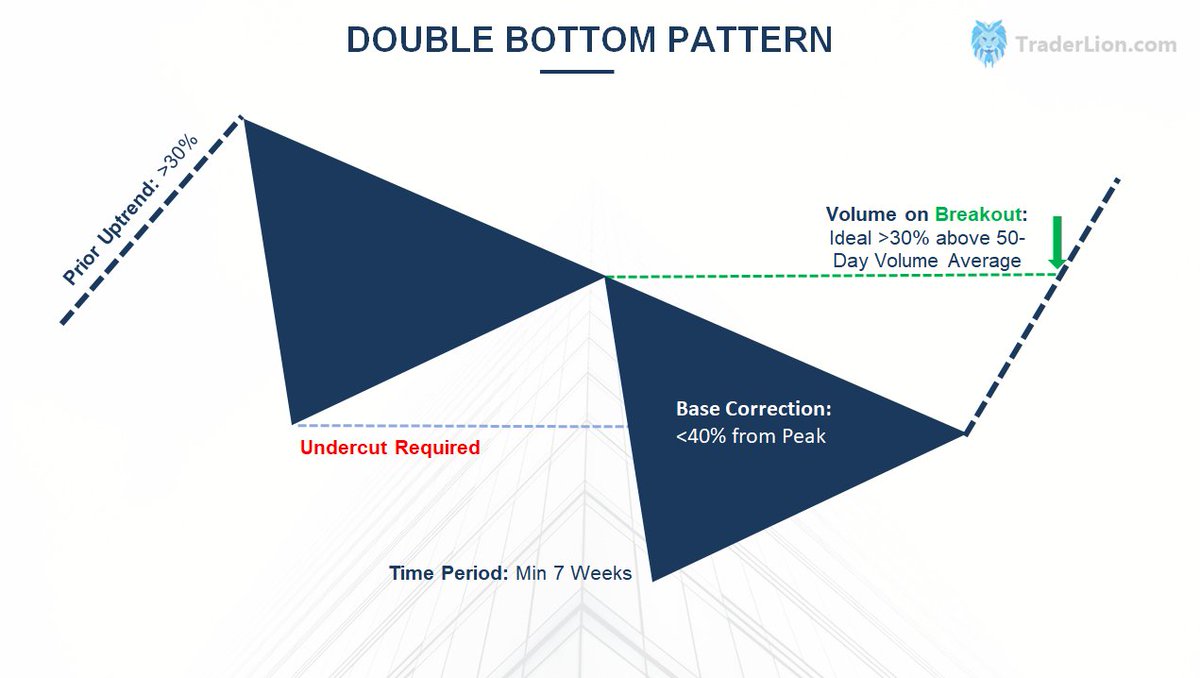
The Double Bottom chart pattern is also very common & is one of the most powerful patterns to learn.
✅ Base resembles a "W"
✅ Base length: Min. 7 weeks
✅ Base depth: < 40%
✅ Buy point: middle of "W"
✅ Second low must undercut first low
✅ Base resembles a "W"
✅ Base length: Min. 7 weeks
✅ Base depth: < 40%
✅ Buy point: middle of "W"
✅ Second low must undercut first low

The Flat Base pattern is another well known structure coined by William O'Neil.
✅ Base resembles a shallow consolidation
✅ Prior uptrend must be greater than 30%
✅ Base length: Minimum of 5 weeks
✅ Base depth: < 15%
✅ Buy point: High of structure
✅ Base resembles a shallow consolidation
✅ Prior uptrend must be greater than 30%
✅ Base length: Minimum of 5 weeks
✅ Base depth: < 15%
✅ Buy point: High of structure


The next structure is called the High Tight Flag (HTF). This is one of the most rare but most powerful base types in the market and if handled correctly can change your year.
For a stock to fit the HTF criteria it must:
✅ Base resembles a pole & flag
✅ Base length: 3-5 weeks
✅ Base depth: < 25% (flag)
✅ Stock must run up 100% in less than 8 weeks (flag pole)
✅Buy Point: High of flag
✅ Base resembles a pole & flag
✅ Base length: 3-5 weeks
✅ Base depth: < 25% (flag)
✅ Stock must run up 100% in less than 8 weeks (flag pole)
✅Buy Point: High of flag


The IPO Base is a must know pattern if looking to achieve superperformance in the markets.
✅ Normal base just for IPOs
✅ Base length: Minimum of 7 days (up to 5 weeks)
✅ Base depth: < 20% (sometimes 50% in some market environments)
✅ Buy point: high of the base
✅ Normal base just for IPOs
✅ Base length: Minimum of 7 days (up to 5 weeks)
✅ Base depth: < 20% (sometimes 50% in some market environments)
✅ Buy point: high of the base


The Ascending Base pattern is another structure you must familiarize yourself with.
✅ Base on base on base pattern with higher lows
✅ Constructed during market weakness
✅ Base length: 9-16 weeks
✅ Base depth: 6-25%
✅ Buy point: High of the third pullback
✅ Base on base on base pattern with higher lows
✅ Constructed during market weakness
✅ Base length: 9-16 weeks
✅ Base depth: 6-25%
✅ Buy point: High of the third pullback


The last pattern you must learn is the Square Box.
✅ Forms after breakout out of a cup & handle / double bottom
✅ Base length: 4-7 weeks
✅ Base depth: < 15%
✅ Buy point: High of the structure
✅ Square box is quicker than a flat base
✅ Forms after breakout out of a cup & handle / double bottom
✅ Base length: 4-7 weeks
✅ Base depth: < 15%
✅ Buy point: High of the structure
✅ Square box is quicker than a flat base


Things to look for near the pivot points of each pattern 👇
✅ Tightness in price action
✅ Dryup in volume under pivot
✅ Increasing volume through the pivot point
✅ Tightness in price action
✅ Dryup in volume under pivot
✅ Increasing volume through the pivot point
These are base patterns so we should expect volume to be BIG when the stock breaks out.
All of the supply has been accumulated by institutions and they begin their markup phase. 📈
Learning these patterns will help you spot & trade the biggest winners in the market!
All of the supply has been accumulated by institutions and they begin their markup phase. 📈
Learning these patterns will help you spot & trade the biggest winners in the market!
If you enjoyed this thread and want to see similar content, follow us @TraderLion_! 👍
If you think your trading or someone else's trading would benefit from this thread, please give the first tweet a retweet. 🔁
If you think your trading or someone else's trading would benefit from this thread, please give the first tweet a retweet. 🔁
• • •
Missing some Tweet in this thread? You can try to
force a refresh