
Ten lessons from my book “The Ultimate Guide to Chart Patterns”
A thread 🧵
A thread 🧵

Trendlines are the identifiers and connectors of resistance and support price levels on chart patterns.
Trendlines are used to measure and quantify the path of least resistance for a chart in your time frame.
Trendlines are identifiers of the trend in your trading time frame.
Trendlines are used to measure and quantify the path of least resistance for a chart in your time frame.
Trendlines are identifiers of the trend in your trading time frame.

You increase your odds of success in vertical price channels by buying in the direction of the channel’s trend.
When trendlines connect higher highs and higher lows, you increase your odds of success by buying the dip in price to the lower trendline.
When trendlines connect higher highs and higher lows, you increase your odds of success by buying the dip in price to the lower trendline.

A bull flag is a powerful bullish chart pattern that is found during strong bull markets. These patterns are often formed in leading growth stocks that have gone parabolic.

A pennant pattern is very similar to a flag pattern, except a flag is rectangular and descending and the pennant is triangular.
A bull pennant chart pattern occurs after an uptrend that follows a previous price base earlier in the chart.
A bull pennant chart pattern occurs after an uptrend that follows a previous price base earlier in the chart.

Cup and handle patterns are not good probability trades if the general market is in a correction or a bear market.
The pattern has better odds if the stock is in a strong sector that has increasing earnings
The pattern has better odds if the stock is in a strong sector that has increasing earnings
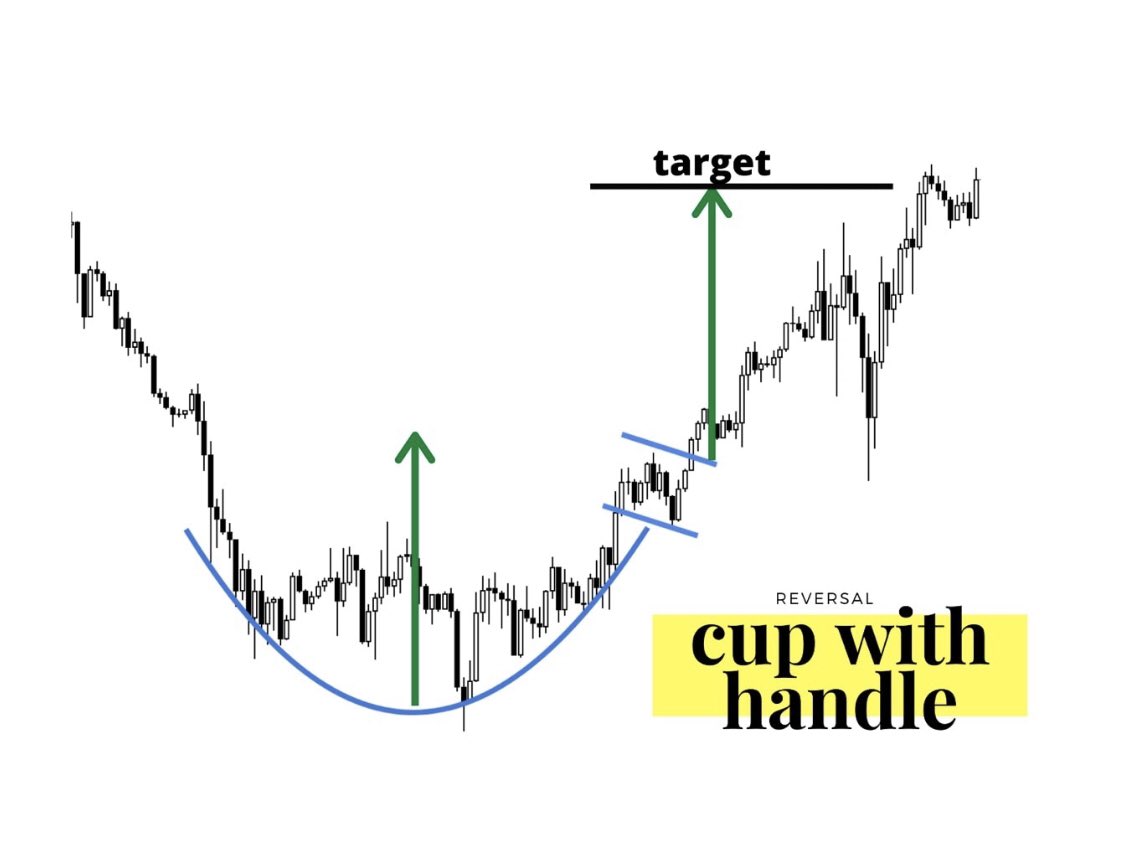
Look for a ‘U’ shape and volume that dries up near the cup’s low. Volume that dries up at the bottom suggests funds lost interest in selling. U-shaped bases are more likely to work than V-shaped.

Volume will often contract as a chart pattern approaches a breakout. A breakout with higher than average volume can give a buy signal a higher rate of success.
Increase your odds by selling rallies into upper trendlines when they connect lower highs and lower lows.
You improve your odds of success in horizontal price channels by buying support and selling resistance.
You improve your odds of success in horizontal price channels by buying support and selling resistance.
Trendlines should connect at least two price levels in a direct path to be considered viable. The more connections that a trendline has, the more meaningful it is.
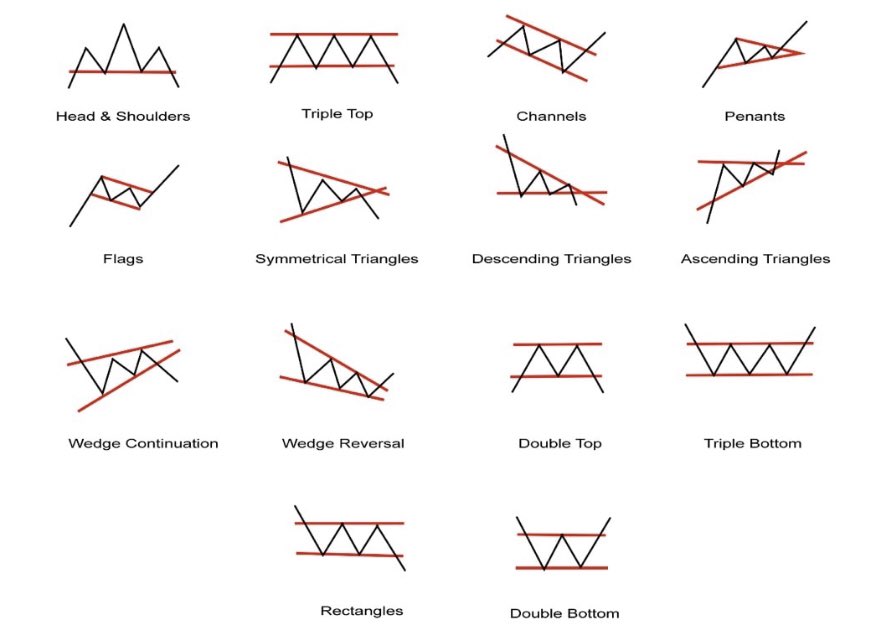
Different chart patterns identify different types of markets: sideways, uptrend, downtrend and reversing.
The purpose of using chart patterns is to identify current price action patterns and trade using signals that capitalize on them.
The purpose of using chart patterns is to identify current price action patterns and trade using signals that capitalize on them.
The Ultimate Guide to Chart Patterns amzn.to/3KhKZEs

• • •
Missing some Tweet in this thread? You can try to
force a refresh


