
When you have a data like shown in this figure (continuous x and y variable) and a clear change in slope at a specific point. What is the best way to capture both elements, the slope prior to 1950 and after 1950? Two regressions? #rstats 
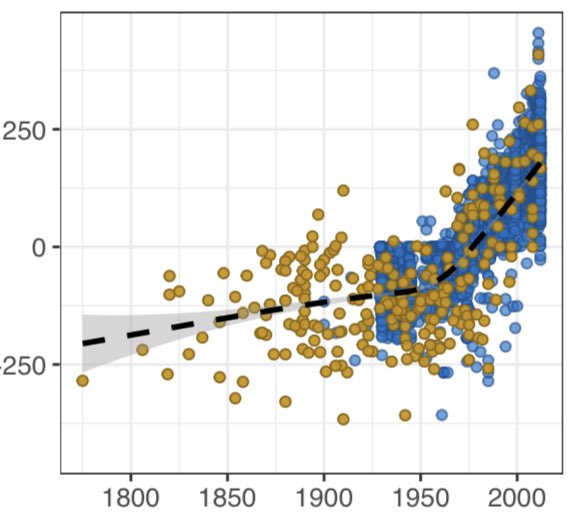
Shown in the figure is the loess curve using geom_smooth(), if it wasn’t obvious
Thanks, everyone! Seems I have enough to go on.
• • •
Missing some Tweet in this thread? You can try to
force a refresh


