Here’s a situation many of us have seen in the ICU or ED: “It looked like there was ST elevation on the monitor but when I took a 12 lead it was gone?!”
A STEMI went MIA? Here’s a #tweetorial all about why ST segments look different on monitors.
#FOAMed #FOAMcc
1/
A STEMI went MIA? Here’s a #tweetorial all about why ST segments look different on monitors.
#FOAMed #FOAMcc
1/


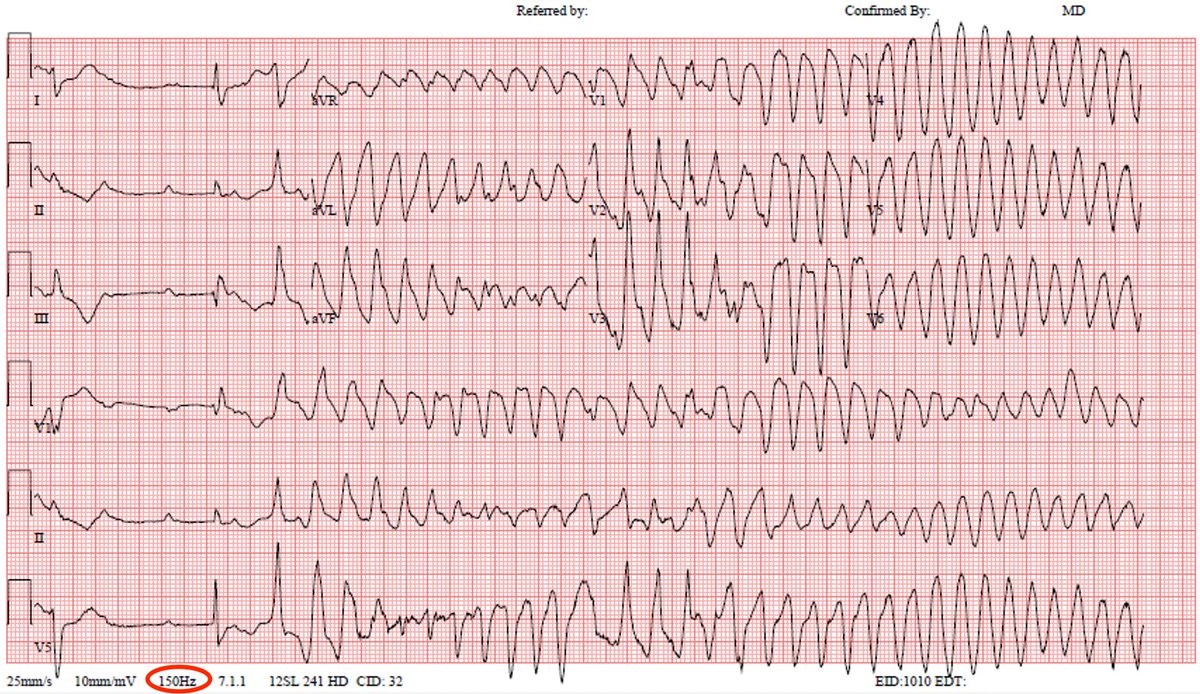
First, here’s another great example of "disappearing ST elevation", from Dr. Smith’s ECG Blog @smithECGBlog
(If you don’t already you should definitely follow Dr Smith & bookmark his site; hqmeded-ecg.blogspot.com IMO it's the best site for ECGs; you can thank me later)
2/
(If you don’t already you should definitely follow Dr Smith & bookmark his site; hqmeded-ecg.blogspot.com IMO it's the best site for ECGs; you can thank me later)
2/

In order to understand *WHY* the ST segment looks different, we need to know how an ECG works & understand just a little bit of electronics & math.
(Don't worry, I promise no equations or circuit diagrams 🤞)
3/
(Don't worry, I promise no equations or circuit diagrams 🤞)
3/
First, we need to understand how an ECG works:
We use a pair of electrodes to measure the difference in electrical potential between two points on the body. We call this pair a “lead".
For example the left and right arm form lead I.
This was true in 1911 & still is in 2022.
4/
We use a pair of electrodes to measure the difference in electrical potential between two points on the body. We call this pair a “lead".
For example the left and right arm form lead I.
This was true in 1911 & still is in 2022.
4/


But there’s a problem: NOISE
Muscle movement/shivering, breathing, baseline wander, & other artifacts can interfere with the EKG signal.
All these types of NOISE would make the EKG almost useless for continuous monitoring.
But fortunately there’s a solution: FILTERING.
5/
Muscle movement/shivering, breathing, baseline wander, & other artifacts can interfere with the EKG signal.
All these types of NOISE would make the EKG almost useless for continuous monitoring.
But fortunately there’s a solution: FILTERING.
5/

Modern ECG monitors use *FILTERS* to remove much of the NOISE.
A bandpass filter allows only certain frequencies to pass:
Blocking low frequencies (<0.5Hz) removes respiration & baseline wander
Blocking high frequencies (>40Hz) removes most muscle twitches & AC interference
6/
A bandpass filter allows only certain frequencies to pass:
Blocking low frequencies (<0.5Hz) removes respiration & baseline wander
Blocking high frequencies (>40Hz) removes most muscle twitches & AC interference
6/

Summary:Bandpass filters remove low frequency (respiration, baseline wander) & high frequency noise (muscle twitches, AC interference, etc) so we get only a perfect clean ECG signal?
Sounds great right?
Well…there’s a catch: Removing NOISE alters the SIGNAL.
7/
Sounds great right?
Well…there’s a catch: Removing NOISE alters the SIGNAL.
7/
To understand why FILTERS alters the signal, we need to review just a teeny bit of math:
It turns out that you can represent *any* complex waveform as a summation of simple sine waves.
For example, look how we can make a sawtooth wave by combining 15 sine waves together👇
8/
It turns out that you can represent *any* complex waveform as a summation of simple sine waves.
For example, look how we can make a sawtooth wave by combining 15 sine waves together👇
8/
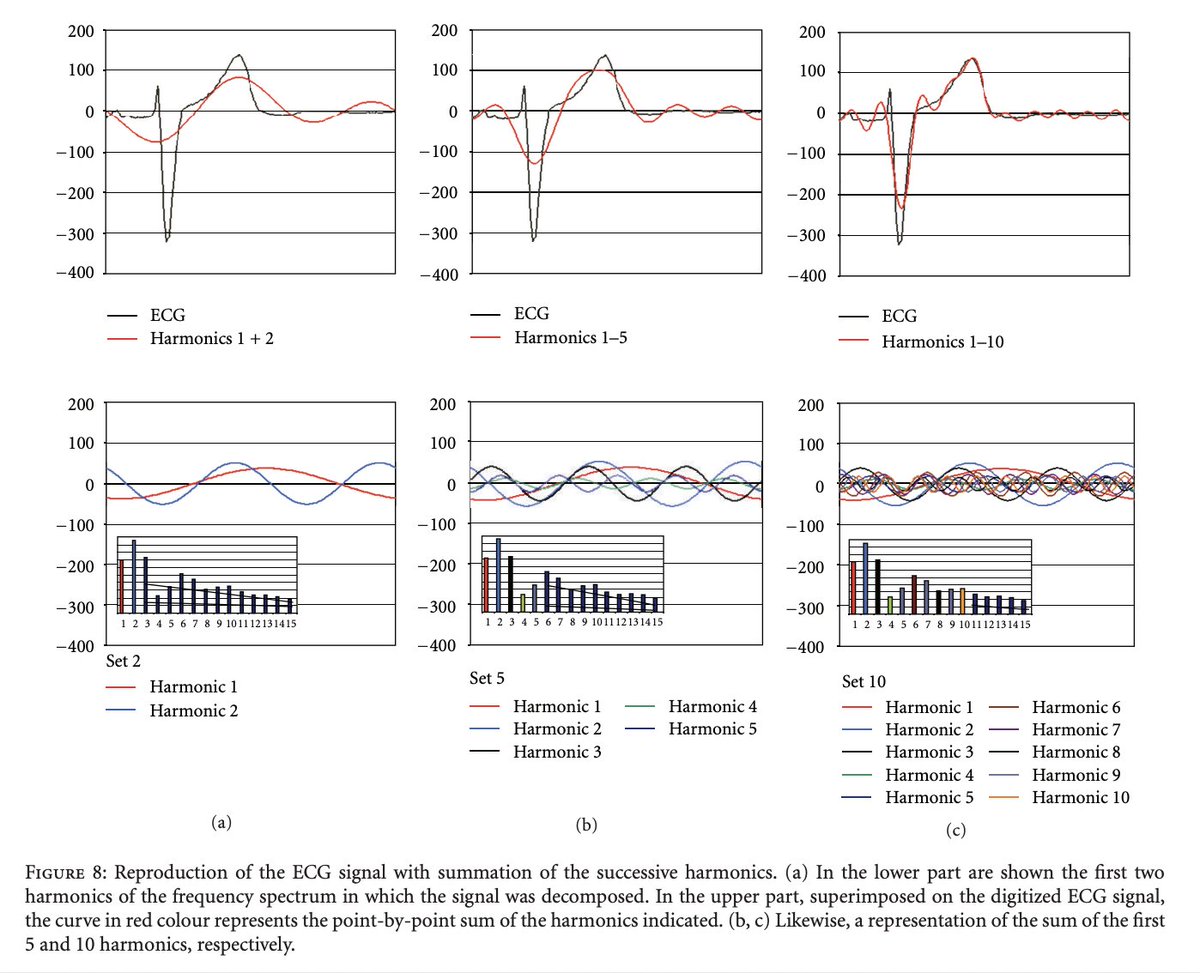
This means that even a complex ECG waveform can be made by combining a bunch of sinusoidal functions of different frequencies (or harmonics).
Check out how they Fourier transformed an ECG into harmonics then put those harmonics back together 👇
hindawi.com/journals/isrn/…
9/
Check out how they Fourier transformed an ECG into harmonics then put those harmonics back together 👇
hindawi.com/journals/isrn/…
9/

🤓 Sidenote: the mathematical name for these sinusoidal functions is a phase vector, usually called a “phasor” for short
That means that when you get an ECG you are really just combining sinusoids, or you could say a “Set of Phasors to Sum”
💥Zing
I’ll show myself out…
10/
That means that when you get an ECG you are really just combining sinusoids, or you could say a “Set of Phasors to Sum”
💥Zing
I’ll show myself out…
10/
The problem is we *NEED* some of those high & low frequency sine waves to make a proper EKG waveform.
The bandpass filters that removed pesky noise also took out some of the signal.
➡️Thus Filtering alters the ST segments!
Checkout how a 0.5Hz filter alters the same ECG:
11/
The bandpass filters that removed pesky noise also took out some of the signal.
➡️Thus Filtering alters the ST segments!
Checkout how a 0.5Hz filter alters the same ECG:
11/


🔑 Point: Because of ECG filters, the ST segment is unreliable on a *MONITORING* ECG
This is why you must always obtain a *DIAGNOSTIC* ECG to properly evaluate the ST segments.
(If I teach you only one thing, remember the memes!)
12/
This is why you must always obtain a *DIAGNOSTIC* ECG to properly evaluate the ST segments.
(If I teach you only one thing, remember the memes!)
12/


Clinical 🥡:
MONITORING ECGs (boxes people are constantly attached to) are used continuously for *rhythm determination*
DIAGNOSTIC ECGs (the thing rolled in, often called “a 12 lead ECG”) should be used for detailed ECG interpretation including analysis of the ST segments
13/
MONITORING ECGs (boxes people are constantly attached to) are used continuously for *rhythm determination*
DIAGNOSTIC ECGs (the thing rolled in, often called “a 12 lead ECG”) should be used for detailed ECG interpretation including analysis of the ST segments
13/


In case you are wondering, this is why patients must “hold still” for diagnostic 12 lead ECGs but the monitoring ECG often looks OK despite movement.
This also explains the Hz number on the bottom left of every ECG printout.
14/
This also explains the Hz number on the bottom left of every ECG printout.
14/

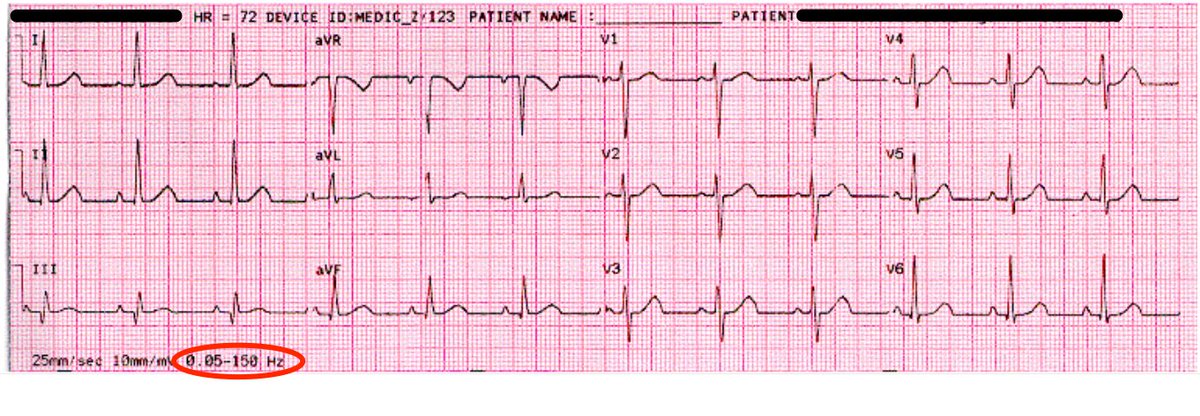
A few more details about filters in ECGs:
- *DIAGNOSTIC* ECGs are typically 0.05 to 150 Hz
- *MONITORING* ECGs are typically 0.67 to 40 Hz (sometimes 0.5 to 50 Hz); narrower frequency range means less noise but also less reliable ST segments.
medteq.net/article/2017/4…
15/
- *DIAGNOSTIC* ECGs are typically 0.05 to 150 Hz
- *MONITORING* ECGs are typically 0.67 to 40 Hz (sometimes 0.5 to 50 Hz); narrower frequency range means less noise but also less reliable ST segments.
medteq.net/article/2017/4…
15/
Some OR monitors have an even more filtered “surgery” mode (1-20 Hz) to remove electrical interference from Bovies
This highly filtered mode can cause some serious artifactual ST elevation as shown in this case report & reply by the manufacturer.
…-publications.onlinelibrary.wiley.com/doi/epdf/10.11…
16/
This highly filtered mode can cause some serious artifactual ST elevation as shown in this case report & reply by the manufacturer.
…-publications.onlinelibrary.wiley.com/doi/epdf/10.11…
16/


🥡 Summary:
-unlike diagnostic ECGs, monitoring ECGs are highly filtered to remove noise
-filtering removes noise but also alters the ST segment; don’t trust ST segments on monitoring mode ECGs!
-ALWAYS obtain a diagnostic 12 lead ECG to properly evaluate the ST segment
17/17
-unlike diagnostic ECGs, monitoring ECGs are highly filtered to remove noise
-filtering removes noise but also alters the ST segment; don’t trust ST segments on monitoring mode ECGs!
-ALWAYS obtain a diagnostic 12 lead ECG to properly evaluate the ST segment
17/17
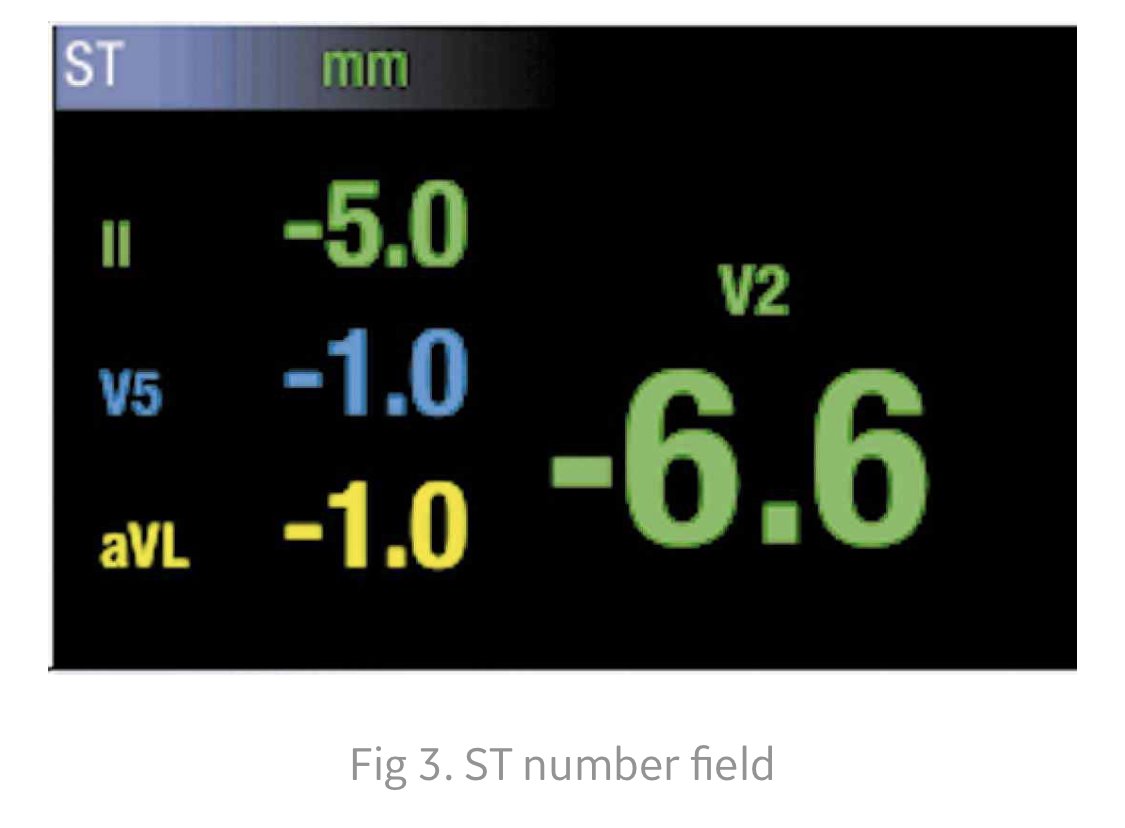
Bonus fact:
Modern Fancy monitors allow continuous ST segment monitoring.
These monitors measure STE/STD in realtime & display it as number.
The displayed waveform is still filtered so you can trust the numbers but NOT what the ST segment looks like.
If in doubt get a 12 lead.
Modern Fancy monitors allow continuous ST segment monitoring.
These monitors measure STE/STD in realtime & display it as number.
The displayed waveform is still filtered so you can trust the numbers but NOT what the ST segment looks like.
If in doubt get a 12 lead.


• • •
Missing some Tweet in this thread? You can try to
force a refresh