November 27, 2024: Our X/Twitter account (@threadreaderapp) got hacked and unrolls aren't working right now. We appreciate your patience until this is resolved.
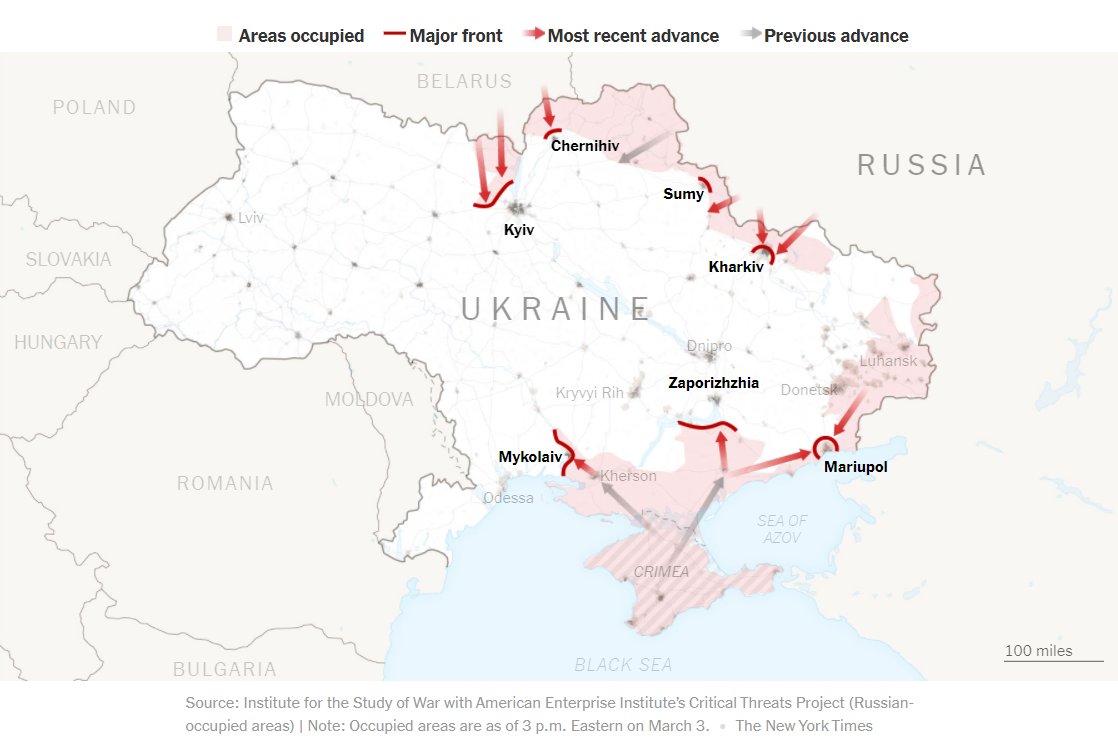
Interesting to see how the @nytgraphics has changed their map symbology as the Russian war in #Ukraine️ unfolds. On Feb 26, large red arrows and an almost opaque red color shows Russian advances in Ukraine. Suggesting fast, large and controlled overtaking. 1/5
By march 3rd, the arrows are considerably smaller, and the occupied areas are shown in a more transparent red color. Suggesting more complexity in the reality on the ground. Still, Ukrainian forces appear non-existent on the map. 2/5
By march 7th, the NYT's maps now show for the first time the Ukrainian forces in blue. Russian forces are given a slightly more pink tone. Occupied areas are rendered with more transparency than before, but cities under Russian control are now labeled in red. 3/5
By March 21st, Ukraine's presence in the map is increased by showing all large cities under Ukrainian control in blue. The 'Russian occupied areas' previously shown in red are no longer shown on the map. 4/5
Curious to know from @nytgraphics how much of these changes in visualization are simply due to strong Ukraine forces, or because there is an increased recognition that different cartographies can significantly change how one understands the war? 5/5
• • •
Missing some Tweet in this thread? You can try to
force a refresh
Arctic Permafrost Atlas (takeaway 1/10): Connect the scales of your story. In the atlas, we show everything from microorganisms to polar maps to help readers better understand the what, the why, and the how of permafrost thaw.
Arctic Permafrost Atlas (takeaway 2/10): Make it personal. To communicate efficiently, don't just reach for your audience's heads... touch their hearts. In the atlas, we include portraits of Arctic inhabitants to bring a human dimension to the permafrost story.
Arctic Permafrost Atlas (takeaway 3/10): Less is more. 🎯 Rather than adding all relevant data to your graphic, try to only keep the bare minimum. This process forces you to ask: What is it that we actually want to communicate with this graphic?💡 (before and after map)
Today is my last day at @GRIDArendal. I joined GRID in 2015, and the ride has been fantastic! 🌞I have had the privilege to work with talented and passionate colleagues and partners from across the world! 🌍
🧵 A thread of work highlights ->
1/9
After a few months I joined colleagues in the UAE to produce a model that could quantify mangrove carbon sequestration capacity based on drone images. Data analysis using all kinds of tools has been a central part of my work. 🔧💻📊
2/9
My most fun GIS project was developing a detailed model to help predict where litter accumulates on the Norwegian coastline.🌊Together with the team at @SALTlofoten, this groundwork has since then flourished in a myriad of new initiatives.