Windows aka “Gaps”
Continuation Patterns Thread, Part 1 🧵
Based off of Japanese CandleStick Charting Techniques.
Continuation Patterns Thread, Part 1 🧵
Based off of Japanese CandleStick Charting Techniques.

1. Windows aka “Gaps”
The Japanese refer to what we call in the West a gap as a “Window”
It is said by the Japanese that corrections stop at the Window, this means windows can become support/resistance areas.
There are two kinds of windows, one bullish and the other bearish.
The Japanese refer to what we call in the West a gap as a “Window”
It is said by the Japanese that corrections stop at the Window, this means windows can become support/resistance areas.
There are two kinds of windows, one bullish and the other bearish.
2.Rising Window/Falling Window
Rising Window: bullish signal, there is a price vacuum between the prior session’s high and the current session’s low
Falling Window: bearish signal, there is a price vacuum between the prior session’s low and the current session’s high

Rising Window: bullish signal, there is a price vacuum between the prior session’s high and the current session’s low
Falling Window: bearish signal, there is a price vacuum between the prior session’s low and the current session’s high


3.Rising Window
A Rising Window should act as a zone of support on pullbacks. If the pullback closes under the bottom of the Window, the prior uptrend is voided.
A Rising Window should act as a zone of support on pullbacks. If the pullback closes under the bottom of the Window, the prior uptrend is voided.
4. Rising Window Chart Example:
I’m Exhibit 7.4 there’s is a very large rising window between $20.50 & $22.50. This gives a $2 zone of support (from the top of the window at $22.50 to the bottom at $20.50) The entire Rising Window becomes a potential support zone.
I’m Exhibit 7.4 there’s is a very large rising window between $20.50 & $22.50. This gives a $2 zone of support (from the top of the window at $22.50 to the bottom at $20.50) The entire Rising Window becomes a potential support zone.

5. Falling Window
A Falling Window implies still lower levels. Any price rebounds should run into resistance at this falling Window. If bulls have enough force to close the market above the top of the falling window, the downtrend is done.
A Falling Window implies still lower levels. Any price rebounds should run into resistance at this falling Window. If bulls have enough force to close the market above the top of the falling window, the downtrend is done.
6. Falling Window Chart Example
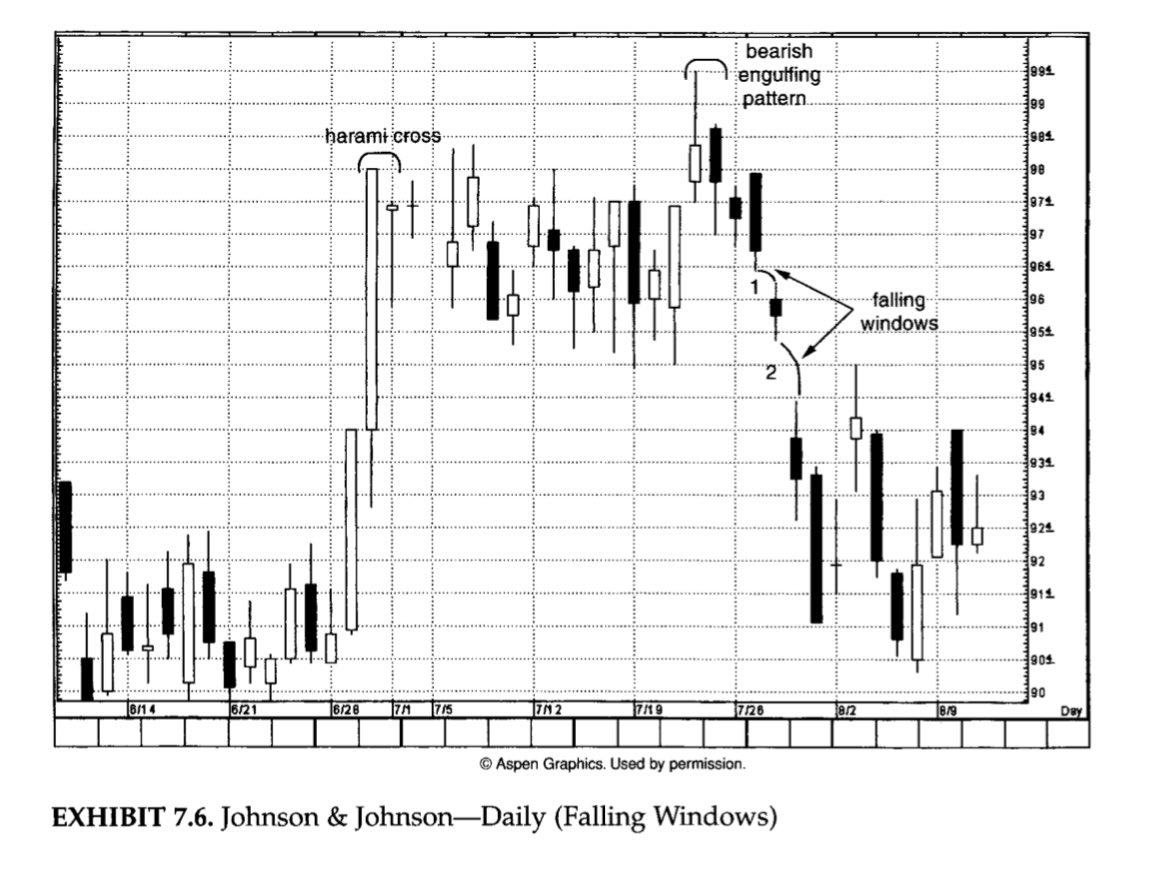
In Exhibit 7.6 a small Falling Window opened between July 27th & 28th (shown as 1) & then another Falling Window (shown as 2) on the 29th. This Falling Window, near $95, became a pivotal resistance level.
In Exhibit 7.6 a small Falling Window opened between July 27th & 28th (shown as 1) & then another Falling Window (shown as 2) on the 29th. This Falling Window, near $95, became a pivotal resistance level.

7. Unusual Whales example of Falling Window with flow
These traders targeted $WIX gap fill from $94.15 to $109.
@unusual_whales
These traders targeted $WIX gap fill from $94.15 to $109.
@unusual_whales
https://twitter.com/Fortuneoptions/status/1509012651392831490

• • •
Missing some Tweet in this thread? You can try to
force a refresh


