
Got an RNA-seq dataset with 50, 100, 200+ samples? Plug it into a differential expression tool and hope for the best? No! You need to consider QC, EDA, and modeling technical variation, or else risk generating spurious results. A thread on papers, methods, and best practices:
Short version:
1) look for outliers (QC) and technical variation with PCA plots
2) consider problems with confounding: model unwanted variation with methods like RUV / SVA / PEER
3) include technical factors in linear model, iterate with respect to positive and negative controls
1) look for outliers (QC) and technical variation with PCA plots
2) consider problems with confounding: model unwanted variation with methods like RUV / SVA / PEER
3) include technical factors in linear model, iterate with respect to positive and negative controls
This is commonly agreed upon. All of the main workflows for Bioconductor DE tools stress quality control and examination of EDA plots such as PCA before any statistical testing, see e.g.
f1000research.com/articles/4-1070
f1000research.com/articles/5-1408
f1000research.com/articles/5-1438
f1000research.com/articles/4-1070
f1000research.com/articles/5-1408
f1000research.com/articles/5-1438
Of course it's not just RNA-seq but all omics data, where changes in the data generation process may affect the high throughput measurements, leading to modeling problems if left unadjusted
ncbi.nlm.nih.gov/pmc/articles/P…
ncbi.nlm.nih.gov/pmc/articles/P…
It's really easy to generate a quick PCA plot for QC and EDA. For example, in DESeq2, once you have a dataset object, it's just 2 lines of code:
dds %>% vst %>% plotPCA
dds %>% vst %>% plotPCA

After removal of outliers, continue to examine any large scale structure that may affect estimation of effects of interest. This is basic linear regression: estimates can be biased and inference invalid unless confounding var's are included in the model (more on estimands later)
Let's pause here: note that nonparametric models won't save you from this problem. They may appear to save you temporarily due to lower power, but as n -> infty they will also reject the null due to shifts in the distribution from confounding, not biological effects of interest
Nonparametric models do provide robustness to model mis-specification. After seeing SAMseq do well in one of our F1000R evaluations in 2018, we've used NP methods in 3 of our recent method publications.
It's just that this benefit doesn't address technical variation.
It's just that this benefit doesn't address technical variation.
In our lab we use the Bioconductor methods RUV and SVA for sequence count data, from @drisso1893 and @jtleek, whenever we have large n. We have both methods demonstrated in our workflow. For more details, see these methods papers:
ncbi.nlm.nih.gov/pmc/articles/P…
ncbi.nlm.nih.gov/pmc/articles/P…
ncbi.nlm.nih.gov/pmc/articles/P…
ncbi.nlm.nih.gov/pmc/articles/P…
They add only a few lines of code to your analysis, e.g. here is how we estimate RUV factors in our scripts. These factors are then included in the full and reduced models during testing.
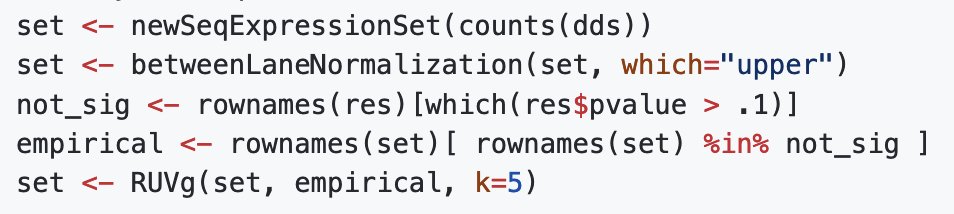
What choice of K, the dimension of the technical variation? We've used iterative analysis, as suggested by the RUV method authors. We've described our use of RUV on large expression datasets here, in this work from @bhattac_a_bt and @AlinaHamilton
ncbi.nlm.nih.gov/pmc/articles/P…
ncbi.nlm.nih.gov/pmc/articles/P…
Another interesting recent idea to estimating the dimension of technical variation was in this recent paper from @xzlab_org lab, where they propose to triangulate across DE and MR signal to optimize K, aiming for defining positive controls empirically
ncbi.nlm.nih.gov/pmc/articles/P…
ncbi.nlm.nih.gov/pmc/articles/P…
On estimands: another important question is if confounding variables interact with treatment or exposure of interest, also rethinking what is the desired effect to be estimated. @sarah_reifeis described applying causal inference methods to DE analysis:
ncbi.nlm.nih.gov/pmc/articles/P…
ncbi.nlm.nih.gov/pmc/articles/P…
You can also approach the problem of causal effects with confounding via matching, as in this paper from Heller et al:
pubmed.ncbi.nlm.nih.gov/19098026/
Or targeted estimators (TMLE), in this paper from @nshejazi et al
semanticscholar.org/paper/Variance…
pubmed.ncbi.nlm.nih.gov/19098026/
Or targeted estimators (TMLE), in this paper from @nshejazi et al
semanticscholar.org/paper/Variance…
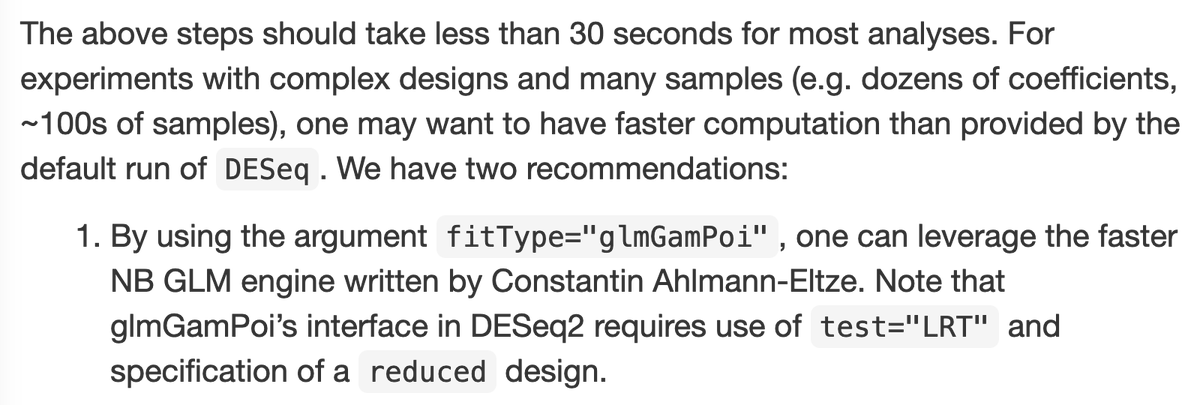
On computational speed on large datasets, want to mention the great work of @const_ae and @wolfgangkhuber to speed up NB GLM in DESeq2 often by an order of magnitude. Easily called from within DESeq2:
ncbi.nlm.nih.gov/pmc/articles/P…
ncbi.nlm.nih.gov/pmc/articles/P…
I've put together a short Rmarkdown document demonstrating basic QC and EDA steps applied to a large RNA-seq dataset (PCA plot, removal of outliers).
Also how to model technical variation using RUV and incorporate those into edgeR or DESeq2 analysis:
github.com/mikelove/preNi…
Also how to model technical variation using RUV and incorporate those into edgeR or DESeq2 analysis:
github.com/mikelove/preNi…
Thx to @amarcobio for conversation about issues modeling large datasets 🙏
• • •
Missing some Tweet in this thread? You can try to
force a refresh


