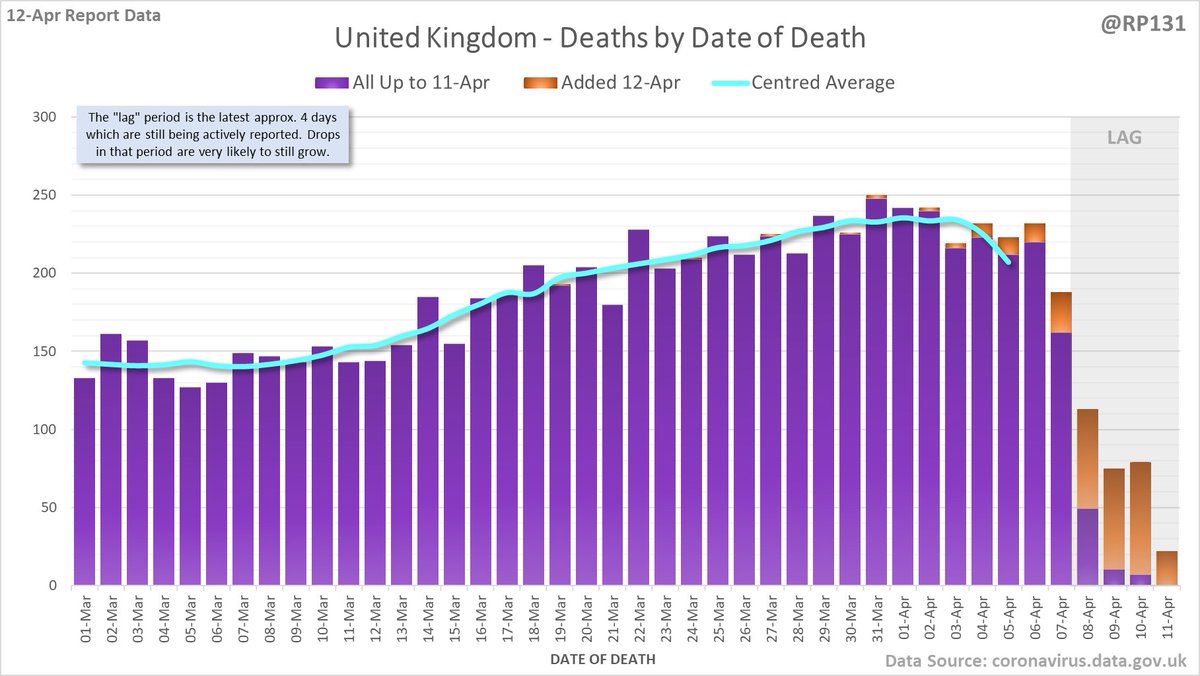
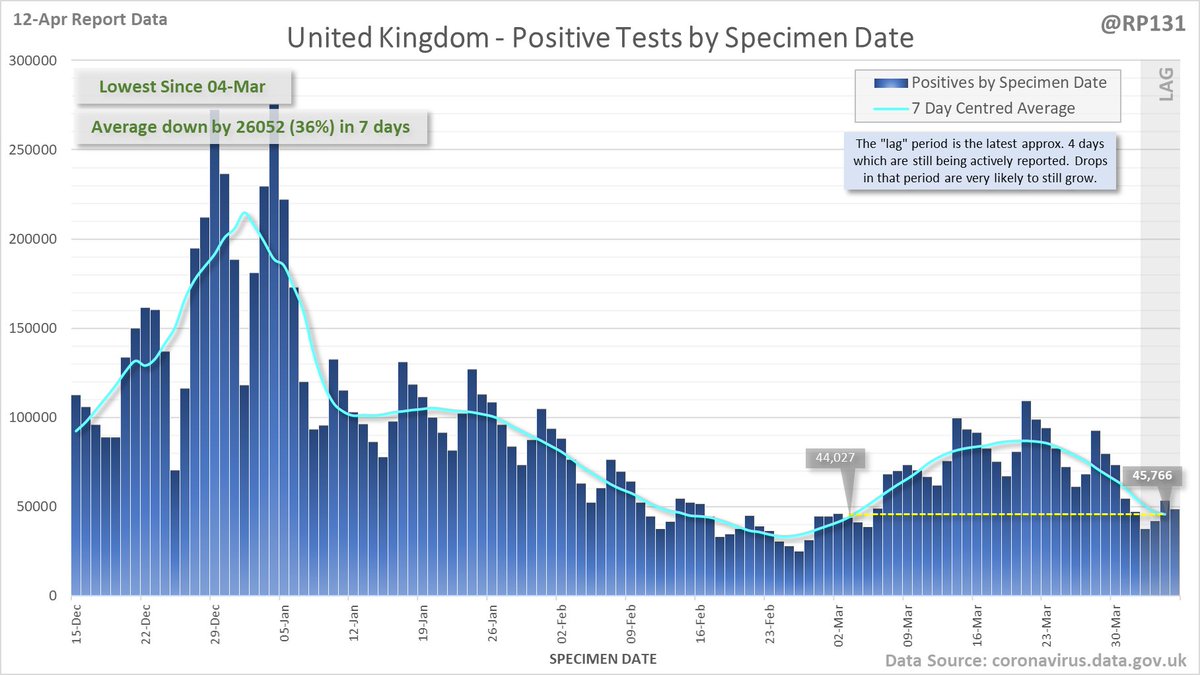
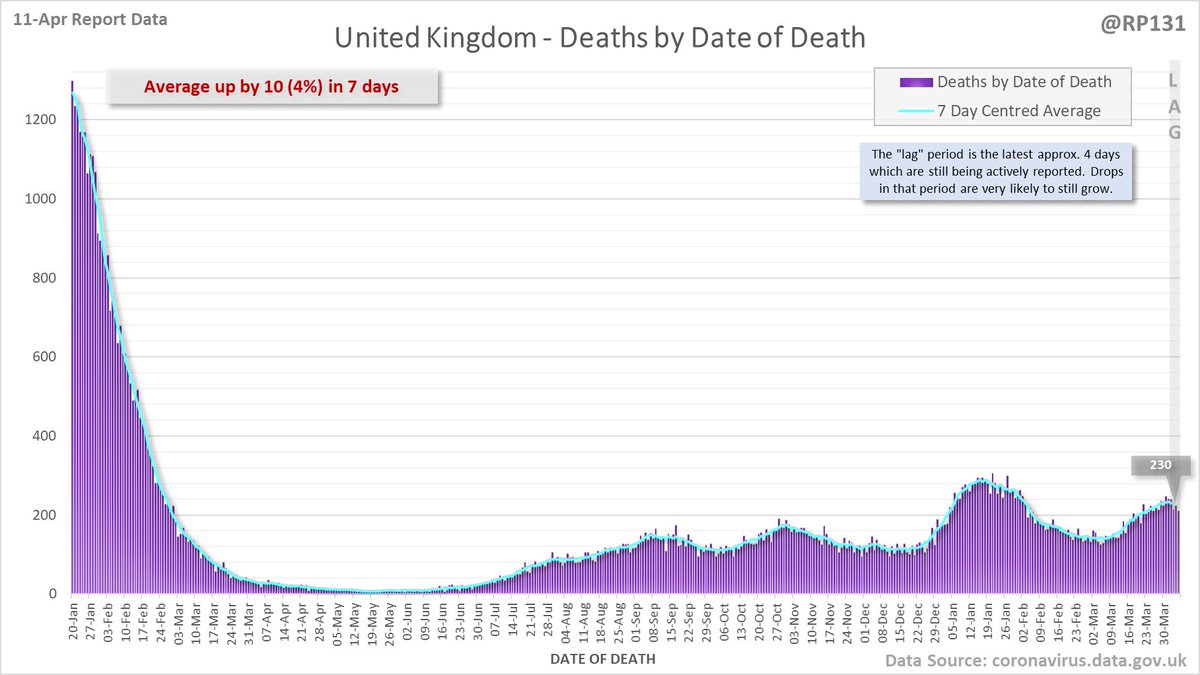
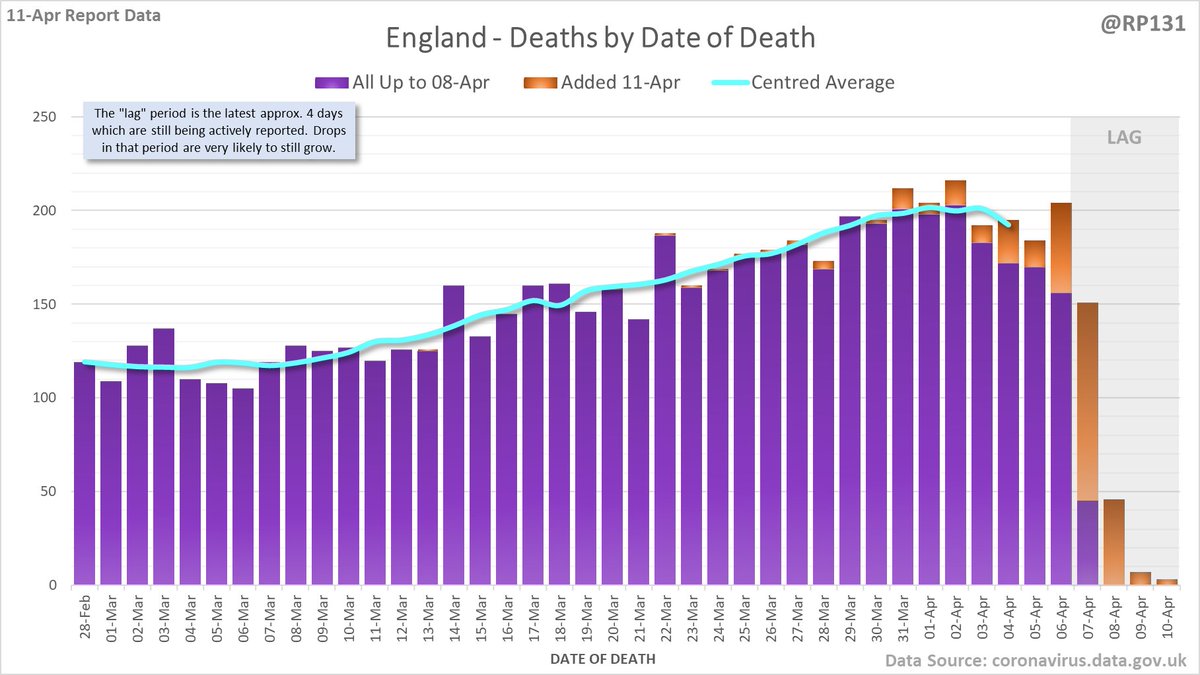
348 new #covid19uk deaths reported today (11-Apr). This brings the rolling average by date of death (allowing 4 days for lag) to 230, an increase of 10 (4.4%) in the last week. 
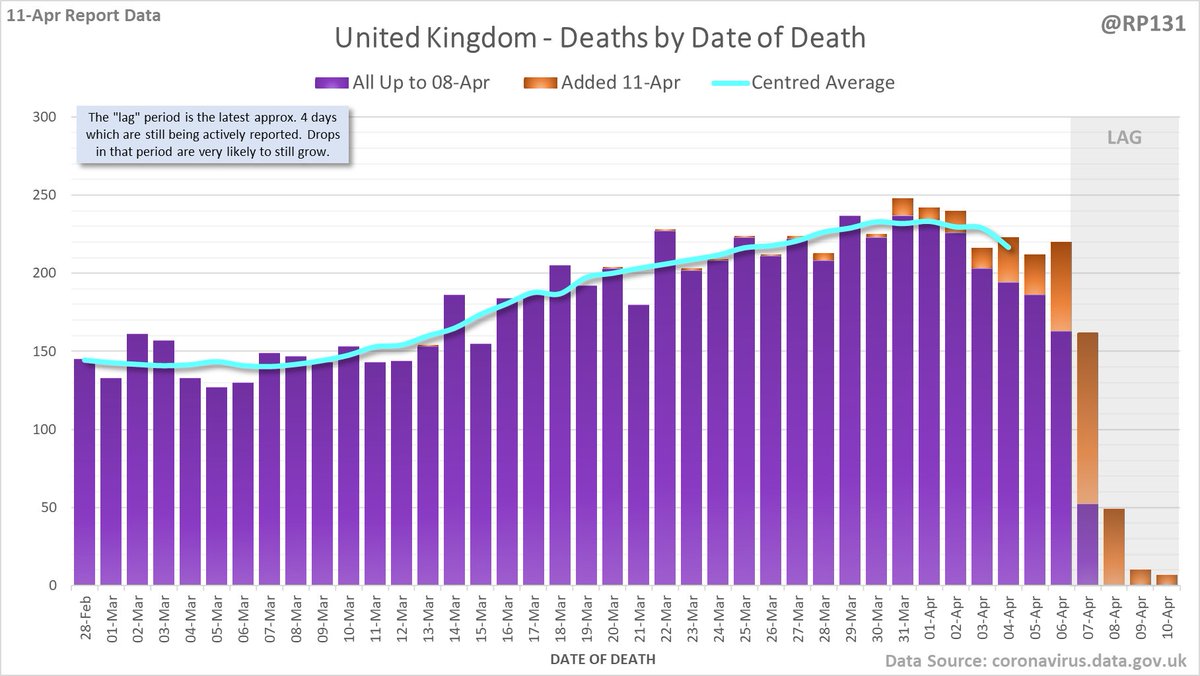
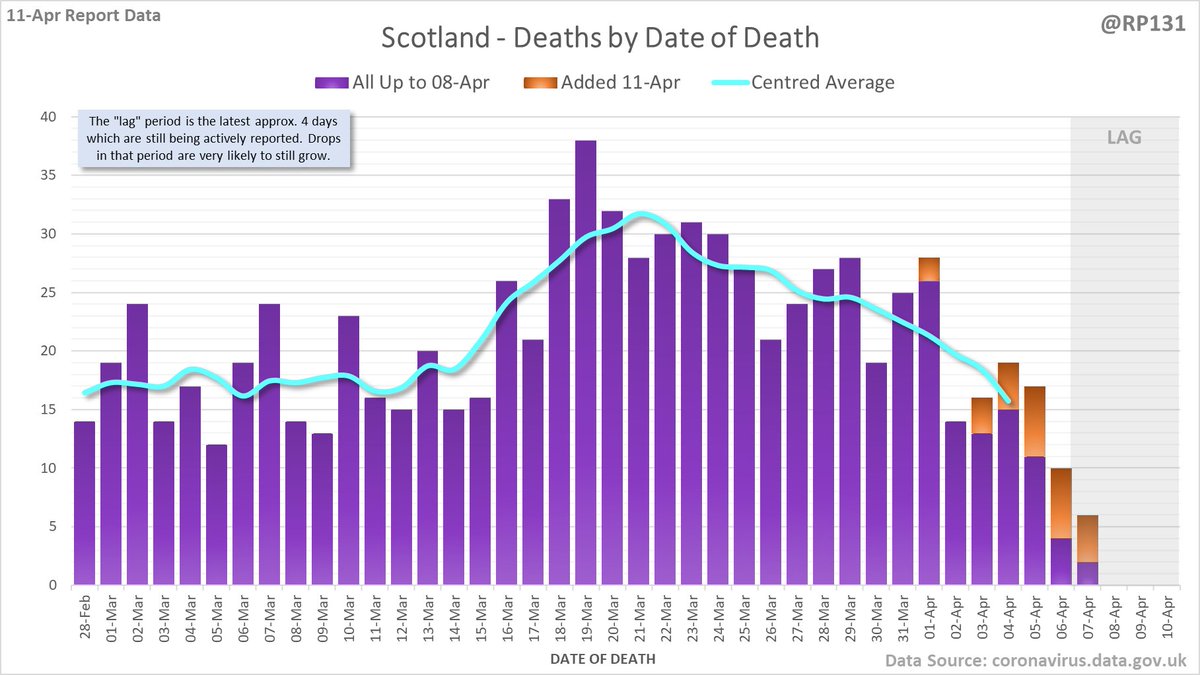
Closer look at the latest 45 days, with today's added numbers highlighted in orange. Individual nations and animated England charts further down the thread.
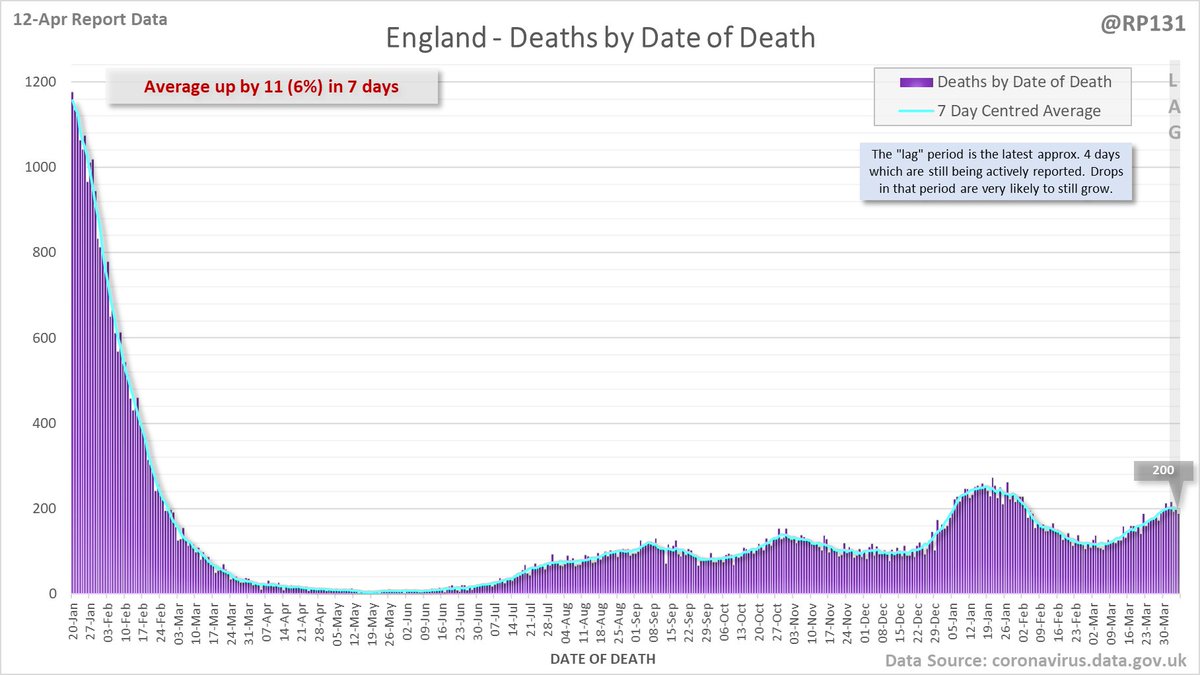
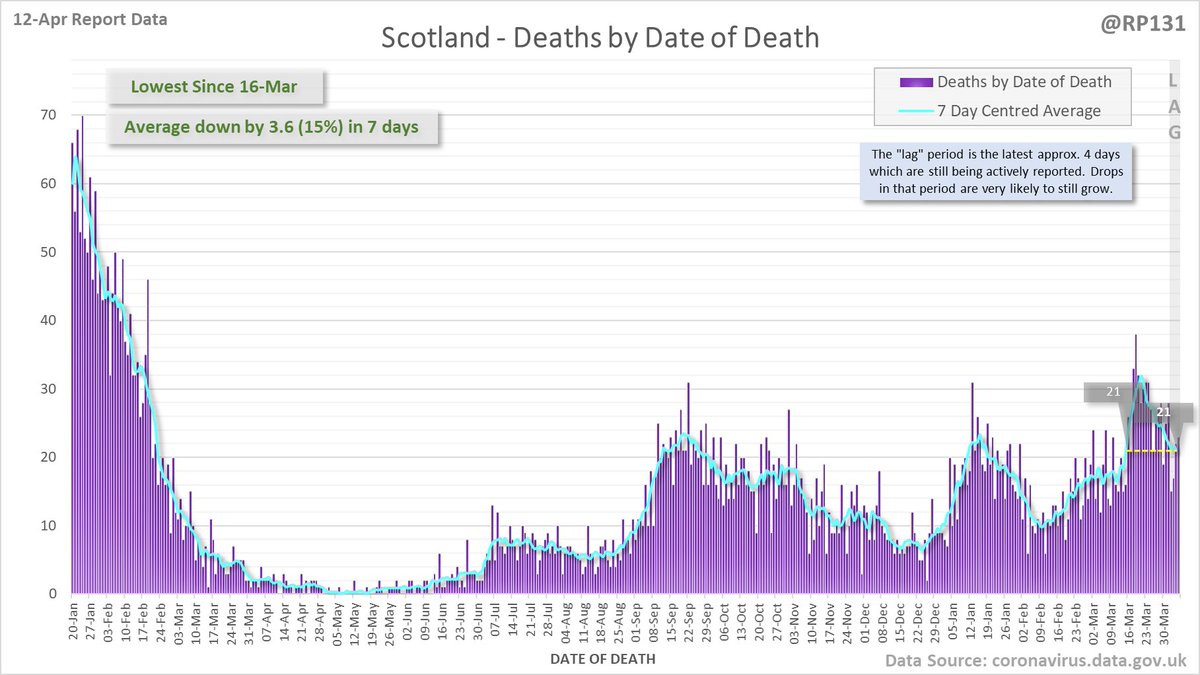
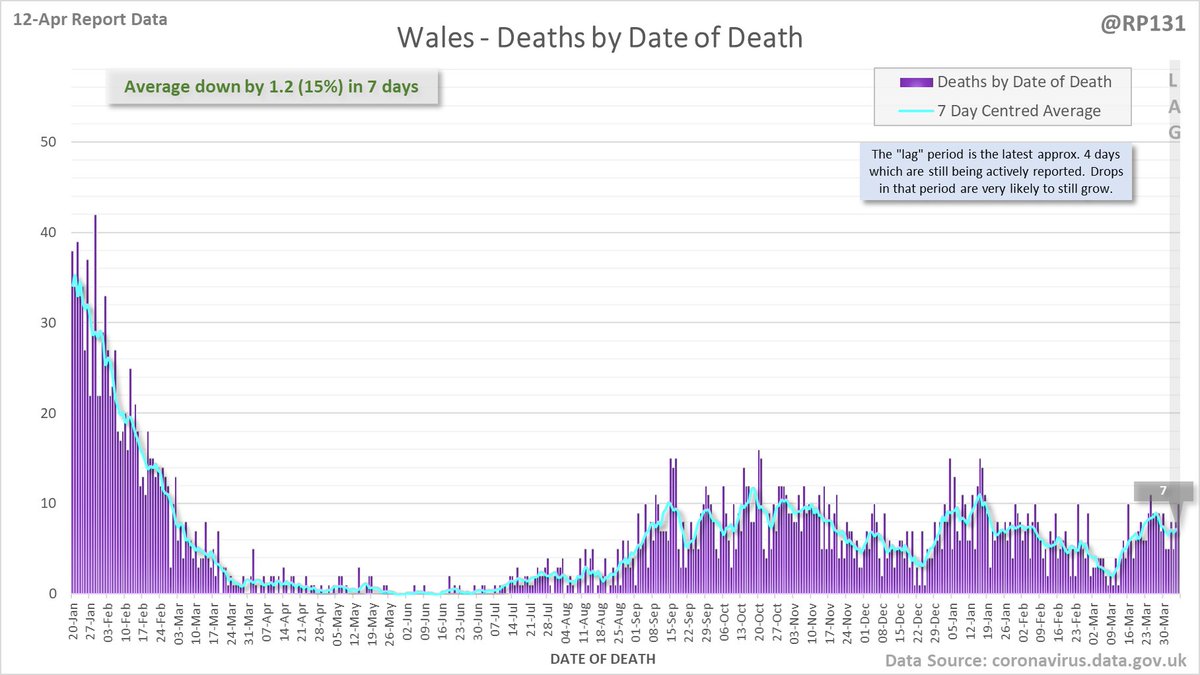
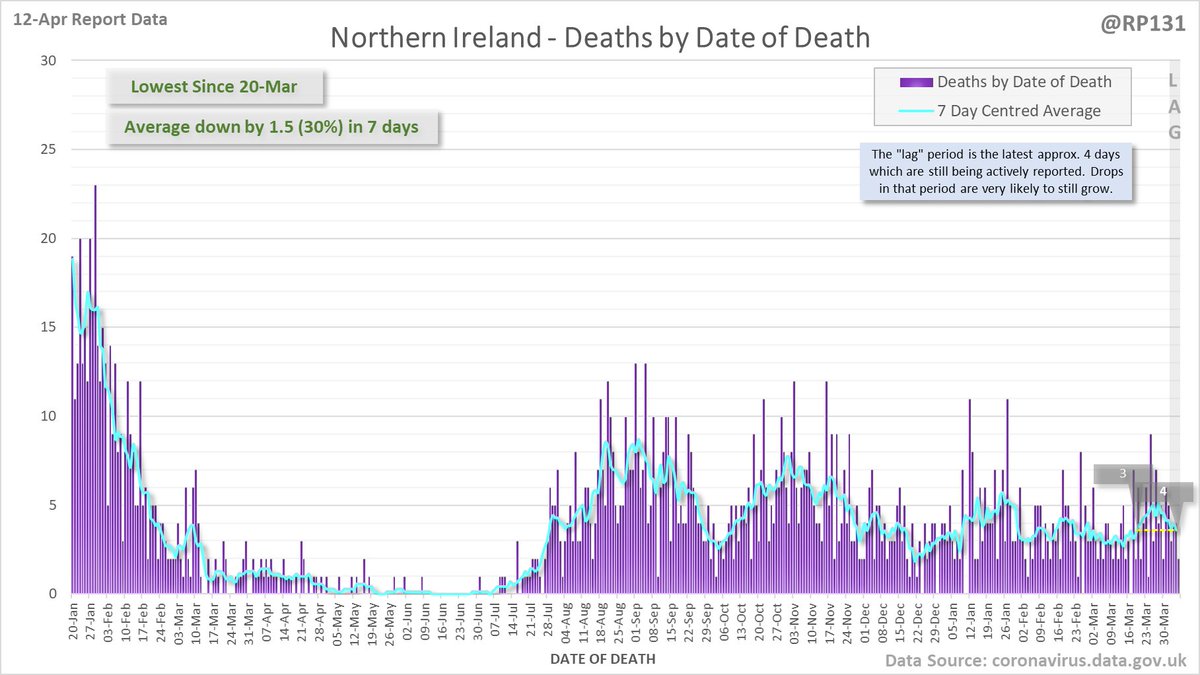
Longer term charts for England, Scotland, Wales and Northern Ireland.


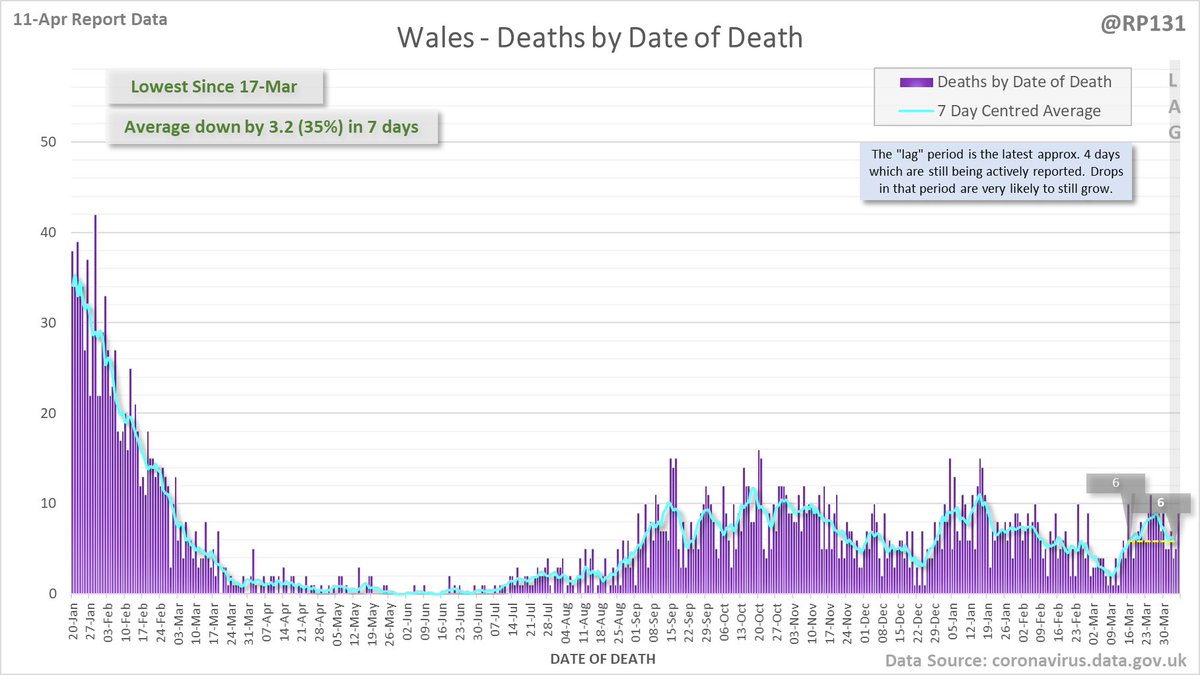
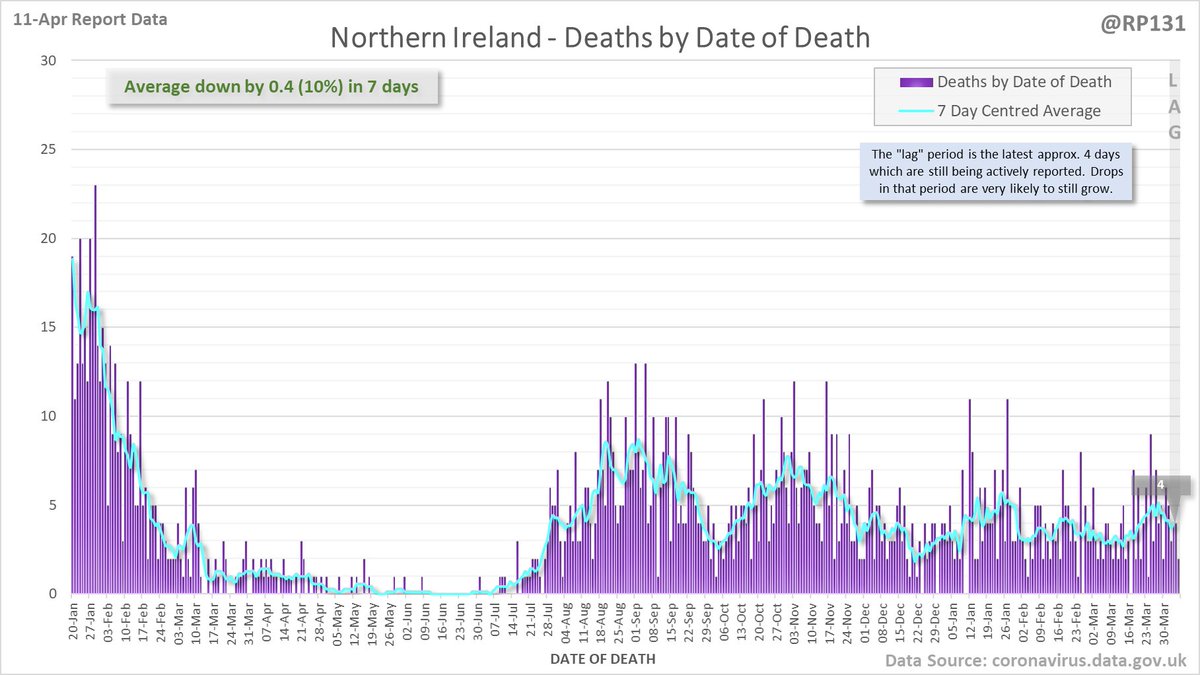
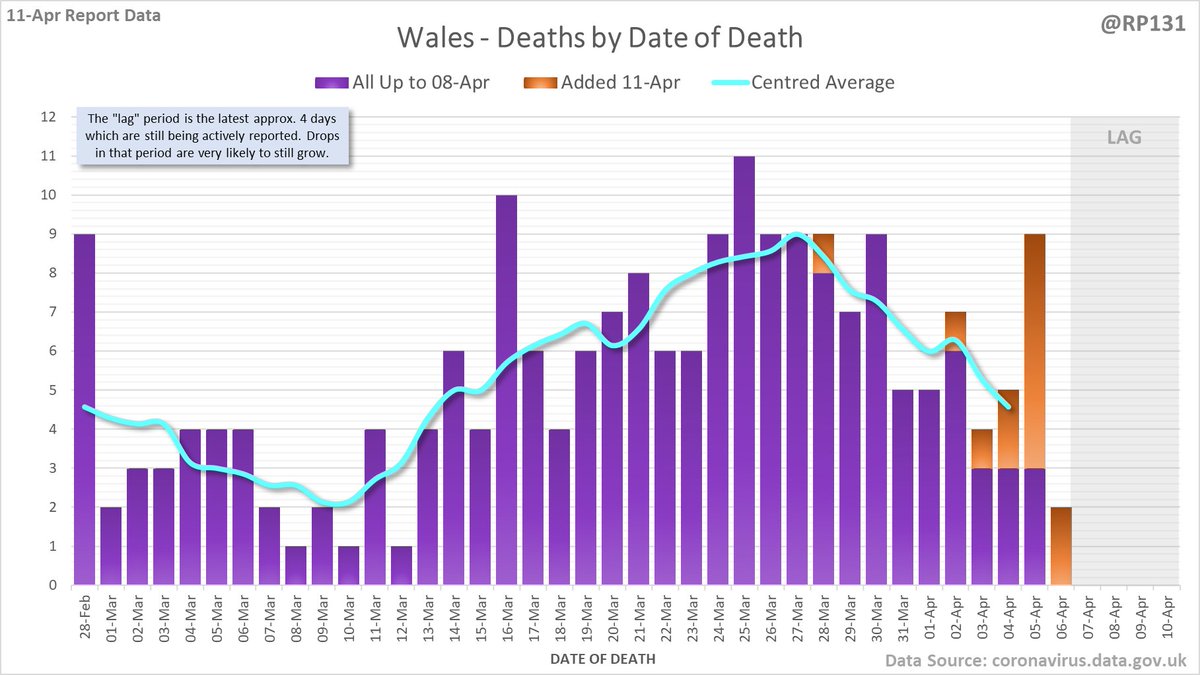
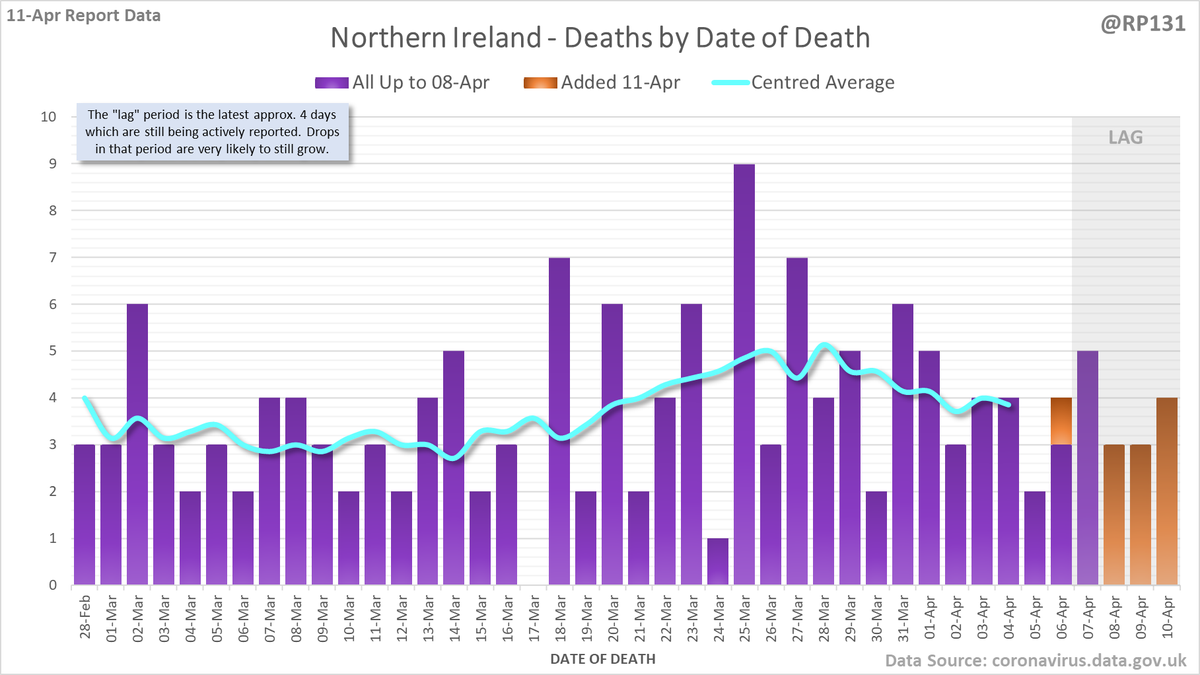
Separate charts for England (301) Scotland (25) Wales (13) and Northern Ireland (9). Note the different scales. Also on certain days the date-of-death data for Scotland/Wales/NI doesn't get updated so the orange bars may be mising or include multiple day's numbers.
Animated chart to show how the #covid19uk deaths by date of death have been contributed to by reports over the last 7 days. Note this just includes England numbers as other nations don't always publish their date-of-death data every day.
Some additional content (mainly regional variations of the above charts) is available in the full version of the thread here: …ddatashare.s3-eu-west-1.amazonaws.com/AdditionDeath/…
• • •
Missing some Tweet in this thread? You can try to
force a refresh