
New publication!
#JournalOfTwitter - 4/11/2022
(PERPRINT Ver 1)
=-=-=-=-=-=
Factors Contributing to Sadness in High School Students During the COVID-19 Pandemic, January through June 2021
=-=-=-=-=-=
Tyler R Black, MD, FRCPC, @UBCmedicine
Author contact: DM😀 /1
#JournalOfTwitter - 4/11/2022
(PERPRINT Ver 1)
=-=-=-=-=-=
Factors Contributing to Sadness in High School Students During the COVID-19 Pandemic, January through June 2021
=-=-=-=-=-=
Tyler R Black, MD, FRCPC, @UBCmedicine
Author contact: DM😀 /1

This is a first-of-its-kind publication, scary! All constructive feedback is welcome.
Results: 9
Interpretation: 24
Limitations: 30
Conclusions: 41
I recommend to quote-tweet the first tweet (title), not later tweets, as new versions may replace old versions.
. /2
Results: 9
Interpretation: 24
Limitations: 30
Conclusions: 41
I recommend to quote-tweet the first tweet (title), not later tweets, as new versions may replace old versions.
. /2
Introduction:
There has been concern about pediatric mental health and the pandemic, which has unfortunately conflated protection measures against the pandemic and the pandemic itself as causes of purported declines in pediatric mental health. /3
There has been concern about pediatric mental health and the pandemic, which has unfortunately conflated protection measures against the pandemic and the pandemic itself as causes of purported declines in pediatric mental health. /3
Changes in pediatric mental health have yet to be fully established. Longitudinal evidence has been reassuring, however, compared to the grim predictions of early, lower-quality cross-sectional surveys.
https://twitter.com/tylerblack32/status/1511941694798716935/4
The CDC's ABES gives an opportunity to get information directly from youth in a nationally-representative cross-sectional survey with many of the questions having been derived from the well-established CDC YBRS.
cdc.gov/healthyyouth/d… /5
cdc.gov/healthyyouth/d… /5
It included students in high school between January and June 2021. During this time, the 2nd Covid Wave had peaked and was on the decline, prior to the delta and omicron waves. Significantly more death occurred per day, and schools were re-opening nationally during this time. /6 

ABES Study Methodology:
7,705 students had valid data of >20 questions answered. The survey used a probability-based sampling approach to obtain a nationally representative sample of students in grades 9-12 attending public and private schools.
see: cdc.gov/mmwr/volumes/7… /7
7,705 students had valid data of >20 questions answered. The survey used a probability-based sampling approach to obtain a nationally representative sample of students in grades 9-12 attending public and private schools.
see: cdc.gov/mmwr/volumes/7… /7
Methods:
The raw dataset from ABES was binarized (ABES provided binarization however the author explored the data description manual and selected binarization), and it was processed in @IBMData SPSS. Statistical tests are available upon request. Excel used for visualization. /8
The raw dataset from ABES was binarized (ABES provided binarization however the author explored the data description manual and selected binarization), and it was processed in @IBMData SPSS. Statistical tests are available upon request. Excel used for visualization. /8

Results:
1) Descriptive Statistics
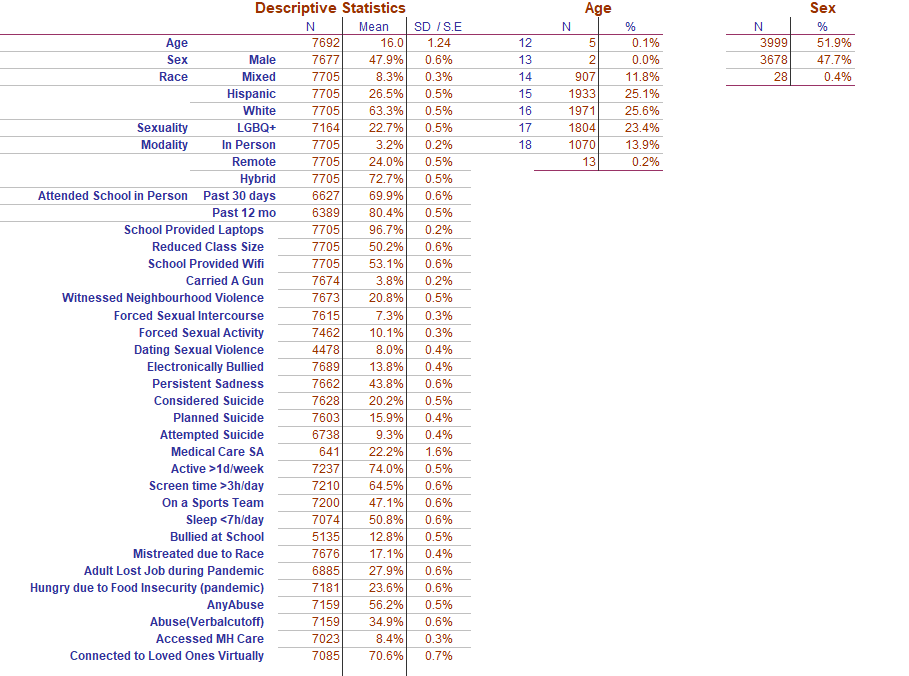
The population and variables studied are presented in this figure.
The average age was 16 years (SD 1.24 years), with distribution as shown. /9
1) Descriptive Statistics
The population and variables studied are presented in this figure.
The average age was 16 years (SD 1.24 years), with distribution as shown. /9
2) Comparison vs Previous YBRS 1991-2019
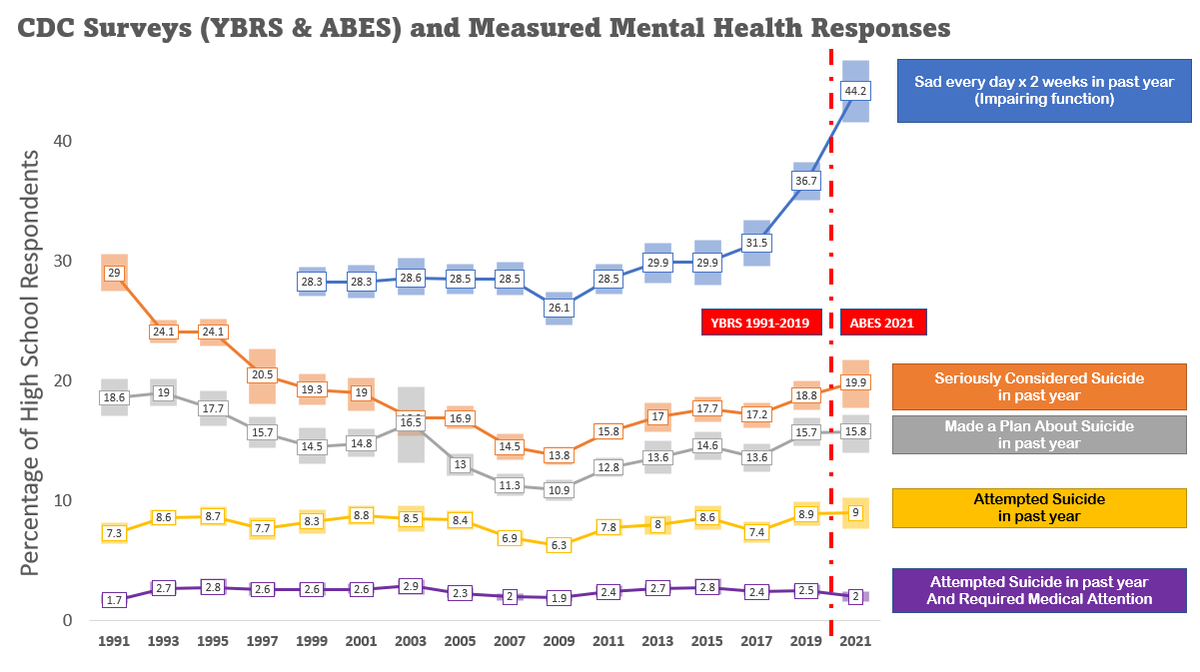
Only the "sadness" statistic is different than the previous years YBRS value, prompting analysis of sadness in results section 3. Youth experiencing suicidality, planning it, or attempting it, are within expected response rates. /10
Only the "sadness" statistic is different than the previous years YBRS value, prompting analysis of sadness in results section 3. Youth experiencing suicidality, planning it, or attempting it, are within expected response rates. /10
3) Factors in Sadness Report
Using the SPSS Automatic Linear Modelling function, a plot of predictors for sadness was created.
Abuse in the Home was most predictive, followed by sex, sexuality, sleep, and racial mistreatment. /11
Using the SPSS Automatic Linear Modelling function, a plot of predictors for sadness was created.
Abuse in the Home was most predictive, followed by sex, sexuality, sleep, and racial mistreatment. /11

A Multinominal Logistic Analysis was run on the top 15 predictors to estimate the coefficients of the relationship between those variables, controlling for age, sex, and race.
The results are presented here. /12
The results are presented here. /12

Significant for being associated with SADNESS:
Abuse in Home (OR 5.04; 4.53-5.60)
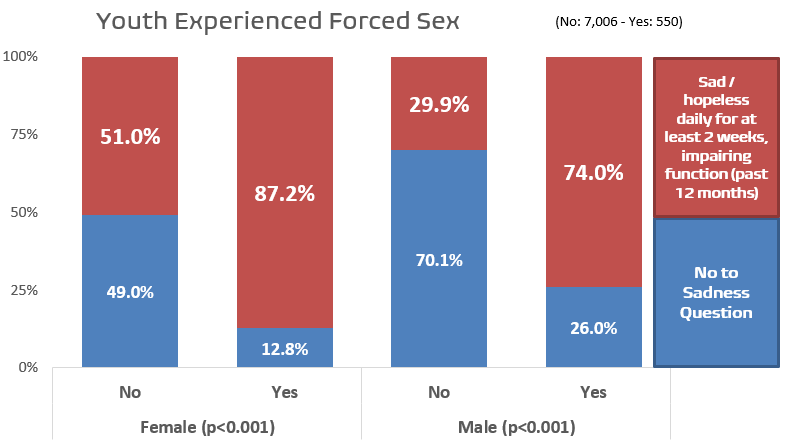
Forced Sex Activity (OR 7.21; 5.95-8.74)
Bullied School (OR 4.77; 3.96-5.75)
Sleep <7h (OR 2.49; 2.26-2.74) /13


Abuse in Home (OR 5.04; 4.53-5.60)
Forced Sex Activity (OR 7.21; 5.95-8.74)
Bullied School (OR 4.77; 3.96-5.75)
Sleep <7h (OR 2.49; 2.26-2.74) /13


Forced Sex (OR 8.19; 6.46-10.38)
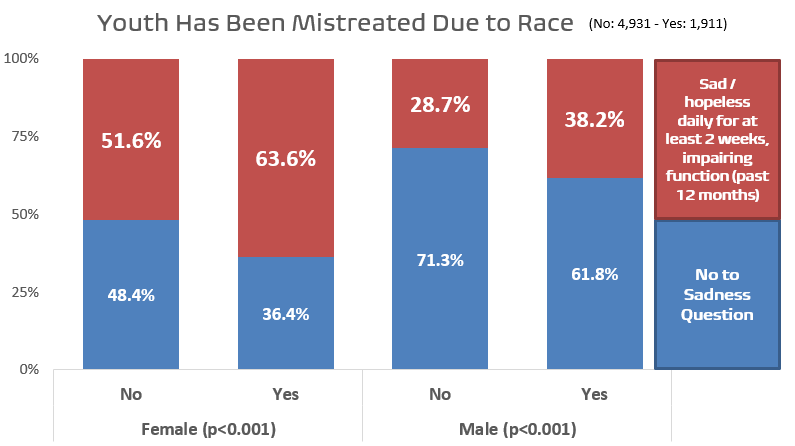
Racial Mistreatment (OR 2.35; 2.14-2.59)
E-Bullied (OR 4.36; 3.77-5.05)
Violence in Neighbourhood (OR 2.37; 2.11-2.65) /14


Racial Mistreatment (OR 2.35; 2.14-2.59)
E-Bullied (OR 4.36; 3.77-5.05)
Violence in Neighbourhood (OR 2.37; 2.11-2.65) /14


Sports Team Participation (OR 0.74; 0.64-0.77)
Screen time >3h/day (OR 1.76; 1.59-1.94)
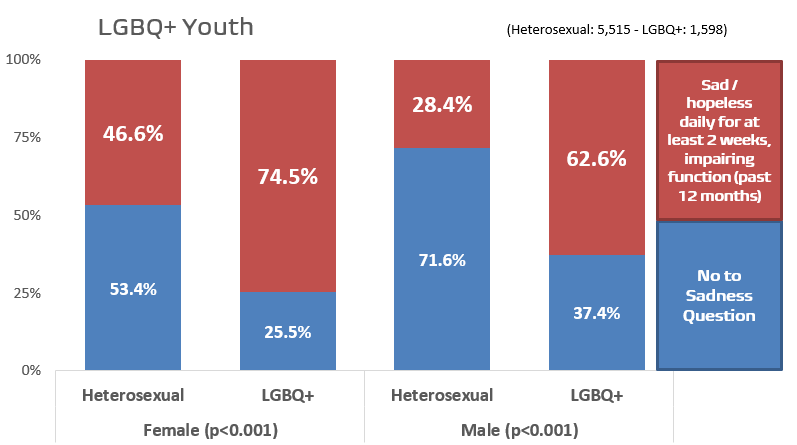
LGBQ+ Youth (OR 4.48 (3.97-50.7) /15


Screen time >3h/day (OR 1.76; 1.59-1.94)
LGBQ+ Youth (OR 4.48 (3.97-50.7) /15


Also Significant for being associated with SADNESS.
Food insecurity during the pandemic (OR 2.64; 2.23-2.79)
Being able to connect with loved ones virtually (OR 0.74; 0.67-0.82)
Adult losing job during the pandemic (OR 1.67; 1.5-1.85) /16
Food insecurity during the pandemic (OR 2.64; 2.23-2.79)
Being able to connect with loved ones virtually (OR 0.74; 0.67-0.82)
Adult losing job during the pandemic (OR 1.67; 1.5-1.85) /16
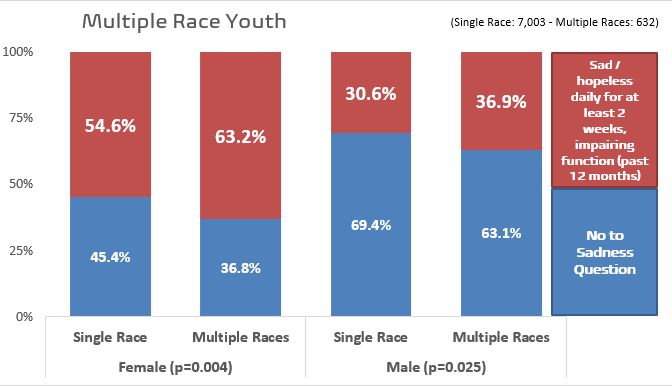
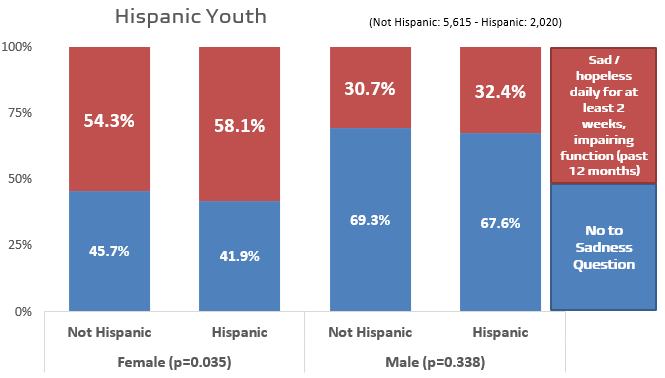
Regarding race, being of multiple races was associated with higher sadness (OR 1.33; 1.13 - 1.57), as was being Hispanic (OR 1.16; 1.05 - 1.29).
Being Black was associated with lower sadness (OR 0.86; 0.77 - 0.96) /17

Being Black was associated with lower sadness (OR 0.86; 0.77 - 0.96) /17
Regarding mode of instruction, relative to children in remote learning situations only:
* Hybrid - OR of sadness the same (1.09; 0.98-1.21)
* In-Person Only - OR of sadness elevated (1.47; 1.13-1.91) /18
* Hybrid - OR of sadness the same (1.09; 0.98-1.21)
* In-Person Only - OR of sadness elevated (1.47; 1.13-1.91) /18

For those that were in hybrid conditions, not being in school for the previous 30 days was associated with a higher odds ratio of sadness (OR 1.30; 1.12-1.52). /19
4) Testing societal vs. activity issues
I selected the conditions of societal mistreatment:
Abuse, Bullying, Food Insecurity, Sexual/Dating Violence, Abuse in the Home, and Witnessing Violence in the Home, and Racial Mistreatment. /20
I selected the conditions of societal mistreatment:
Abuse, Bullying, Food Insecurity, Sexual/Dating Violence, Abuse in the Home, and Witnessing Violence in the Home, and Racial Mistreatment. /20
For those with no factors, n=1232:
Sadness: 15.4%
Considered Suicide: 2.8%
Attempted Suicide: 0.6%
For those with all of the factors, n=32:
Sadness: 93.8%
Considered Suicide: 83.9%
Attempted Suicide: 50.8% /21

Sadness: 15.4%
Considered Suicide: 2.8%
Attempted Suicide: 0.6%
For those with all of the factors, n=32:
Sadness: 93.8%
Considered Suicide: 83.9%
Attempted Suicide: 50.8% /21


Testing child behaviours:
Sleep7+h, activity2-7d, screen<3h, n=576
Sadness: 25.3%
Considered Suicide: 9.6%
Attempted Suicide: 4.6%
Sleep<7h, activity0-1d, screen 3+h, n=898
Sadness: 62%
Considered Suicide: 32%
Attempted Suicide: 13% /22

Sleep7+h, activity2-7d, screen<3h, n=576
Sadness: 25.3%
Considered Suicide: 9.6%
Attempted Suicide: 4.6%
Sleep<7h, activity0-1d, screen 3+h, n=898
Sadness: 62%
Considered Suicide: 32%
Attempted Suicide: 13% /22


5) Mental Health Ratings
Children with none of the social mistreatment/abuse factors as "never to sometimes" poor (83.5%)
Children with all of the mistreatment/abuse factors rated their pandemic mental health as "mostly or always" poor (88%) /23

Children with none of the social mistreatment/abuse factors as "never to sometimes" poor (83.5%)
Children with all of the mistreatment/abuse factors rated their pandemic mental health as "mostly or always" poor (88%) /23


Interpretation:
Contrary to the moral panic about pediatric suicidality, none of the suicidality measures in 2021 were significantly different than previous trends. Sadness, on the other hand, had increased in 2019 and continued to increase sharply in 2021. /24
Contrary to the moral panic about pediatric suicidality, none of the suicidality measures in 2021 were significantly different than previous trends. Sadness, on the other hand, had increased in 2019 and continued to increase sharply in 2021. /24
Many have focused on remotely/in-person school, or pandemic-related restrictions being in place, but the results of this analysis align with largest body of evidence showing that societal factors have always played a large role (see this thread):
https://twitter.com/tylerblack32/status/1175297211183202307/25
It is important to note that school is a driver of stress and distress for children. It is strongly associated with suicide deaths, ER presentations for mental health concerns, bullying, systemic exclusion and anxiety problems.
https://twitter.com/tylerblack32/status/1502690939701182468/26
A moral panic that "suicidality in kids" has increased creates an over-reliance on one data point (eg: CDC report showing "53% increase in suicide attempts for adolescent girls) vs. every other data point (including a decrease in boys + later return to baseline for girls). /27 


Results for suicidality are consistent with previous years YBRS scores (See limitations below) as well as with the observation that deaths by suicides, themselves, did not change in the pediatric population outside of expected trends.
https://twitter.com/tylerblack32/status/1493631248945795079/28
The sadness result is difficult to interpret. The YBRS has had a 5.4% increase in 2015-2017, and a 16.6% increase to 2019. The ABES result is a 20.4% increase. If this is part of a trend, it lessens the likelihood that sadness is wholly due to pandemic factors. /29 

Limitations:
1) ABES authors caution against comparing directly to the YBRS, however survey comparisons are common in the literature and highly heterogeneous. The similar sampling, and question design makes it likely MORE appropriate than most survey comparisons. /30
1) ABES authors caution against comparing directly to the YBRS, however survey comparisons are common in the literature and highly heterogeneous. The similar sampling, and question design makes it likely MORE appropriate than most survey comparisons. /30
For the mental health questions specifically, they are so similar in form, distribution, and response style, that given the population is nationally representative it probably represents the *best* comparison outside of the longitudinal studies presented in the introduction. /31
I personally disagree that YBRS and ABES should not be compared, as worse comparisons are happening regularly in published literature with the severe heterogeneity. However, caution is necessary as sampling is different in ABES. /32
2) Cross sectional surveys only reveal associations - they can not determine direction (sadness caused by more screen time vs more screen time caused by sadness) or causality (all of the variables only accounted for 46% of the variance, suggesting many hidden factors). /33
3) Despite asking about sexuality, there were no questions about trans or non-cis gender status. This neglects a known strong confounder as trans/non-gender-conforming kids are an overrepresented youth group for suicidality. /34
4) The ABES (and YBRS) neglect non-suicidal self injury entirely, which is a significant omission and a major behaviour of distress for adolescent youth. /35
5) The ABES makes no attempt, puzzlingly, to ask about impacts of COVID (like getting sick, someone dying, fearing illness, etc). This is a particularly bizarre omission for the CDC and leaves the ongoing question of pandemic vs pandemic measure confounding. /36
6) Both the physical and verbal abuse questions were asked by the CDC differently in the ABES than in previous American child abuse surveys. I don't believe this affected the Physical Abuse Question (as written, it seems to hold for most Definitions of Physical Abuse) /37 

However, the verbal abuse question is extremely different, and worded in a way that adds ambiguity. It's not clear if, as written, this would constitute a definition of "verbal abuse". For this reason, I've opted (with much consideration) to include "Rarely or No" as "0." /38 

Fortunately, this did not affect the results significantly. Abuse in the home remained the top predictor of sadness regardless of binarization. /39
7) As a twitter-only scientific publication, there is no precedent for formatting and sacrifices for space were made. Grammar is far less important on twitter, but clarity may be compromised. /40
Conclusion:
Sadness survey measures, but not suicidality survey measures, increased for high school students in 2021 compared to previous years. Many factors were related to sadness, but the strongest were social ones like child abuse, sexual assault, and racial mistreatment. /41
Sadness survey measures, but not suicidality survey measures, increased for high school students in 2021 compared to previous years. Many factors were related to sadness, but the strongest were social ones like child abuse, sexual assault, and racial mistreatment. /41
Behavioural factors were also significantly associated with sadness, including less sleep, less activity, connecting with others virtually, and more screen time. /42
Racial differences were also seen with multiple-race and Hispanic youth having more sadness, and Black youth less. /43
In-person schooling only (not remote only) was associated with sadness weakly, but schooling modalities were relatively unimportant as a predictor or factor in reported sadness. /44
These types of factor analyses are crucial to understanding who thrived and who was harmed during the pandemic and our response to it, and counter the prevailing moral panic that school instruction or pandemic measures are the important factors for mental health. /45
The largest forces negatively affecting children's sadness and suicidality are complex, whole-society issues that cannot be fixed by "returning children to school" or "talking about mental health." /46
Citations:
This relies almost exclusively on the CDC's YBRS, and ABES Data. Other citations are linked.
ABES: cdc.gov/healthyyouth/d…
YRBS: cdc.gov/healthyyouth/d… /47
This relies almost exclusively on the CDC's YBRS, and ABES Data. Other citations are linked.
ABES: cdc.gov/healthyyouth/d…
YRBS: cdc.gov/healthyyouth/d… /47
Edits will be added/clarifications will be added below here. For Major edits, a re-publishing will occur.
I've done my best to publish this at a reading level for most of the Twitter public. /48
I've done my best to publish this at a reading level for most of the Twitter public. /48
(Minor edit) to be updated: Tweet 27 has a placeholder graphic with mouse-written text over it, to be replaced with the final version
(minor edit: PREPRINT not PERMIT) 😵💫😵💫
• • •
Missing some Tweet in this thread? You can try to
force a refresh


