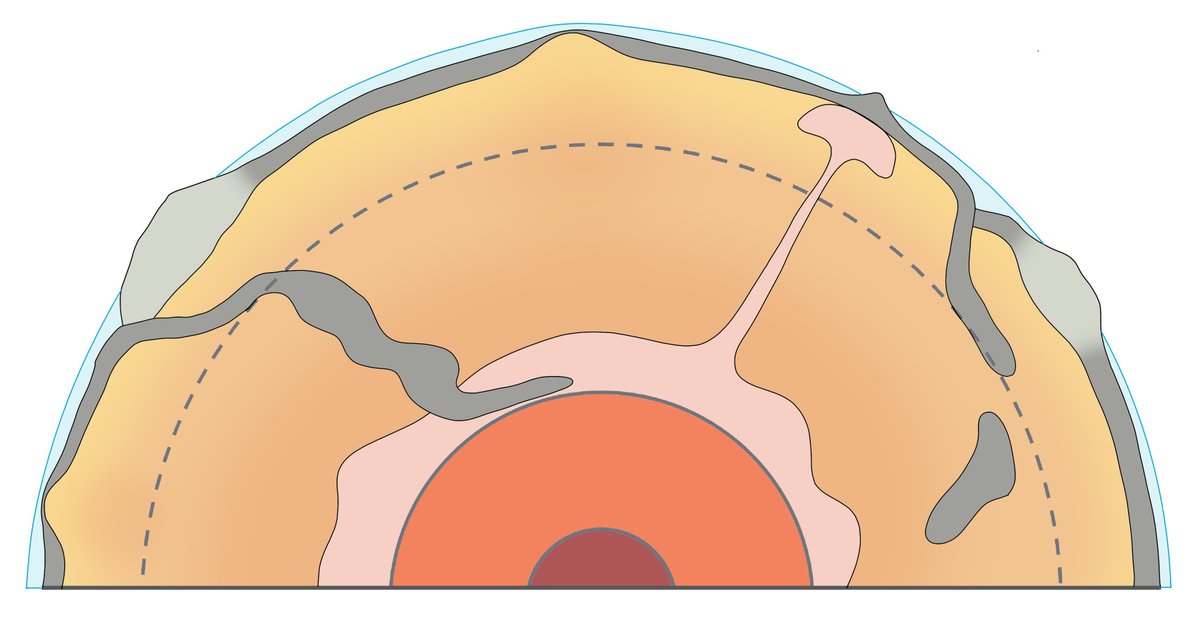
A🧵of some of my graphics on tectonics.

1/ The "world premiere"😉of my summary graphic on the main processes at work causing plates motion. I shared this in my #GAConf22 session this afternoon, but now it's time to share it more widely!
2/ Blank versions of the above if you want to incorporate them into your own presentations for your pupils.
3/ A gif to show how the plates move primarily due to gravitational slide as cold, dense lithosphere sinks into the mantle (aided by the sliding of new plate material down the slopes at the divergent margins). The plates thus drive convection, rather than being driven by it.
4/ How evidence from seismic tomography supports this view - we can see the slabs sinking far down into the mantle.

Use the fabulous atlas-of-the-underworld.org/hades-underwor… to explore the mantle for yourself!
5/ I get my pupils to do just this in class...
6/...and here's what they're able to see!

Great to get them to think like scientists in this process.

'Do we know for certain what's going on?' one asked me.

'No', I replied.

'So we're just guessing?!'

'No - we're doing science! Testing hypotheses against evidence.'
7/ And, when we do so, we can see how well our model works in a real world context. Can you see the links between the model and the evidence?
8/ Then we can start to explore all sorts of locations around the world, testing out our model, seeing through seismic tomography what is going on in the mantle.
9/ From there, it's possible to add more and more nuance to our understanding as we take our model and apply it to specific locations to explore in detail what tomography reveals.
10/ Then we can find ways of visualising this to communicate the complexities of the tomography in a more accessible manner.
11/ In fact, South America is an interesting place to explore subduction as we discover that, just as there are not neat convection cells of rising mantle material, so the slabs don't subduct in neat sheets either. Welcome to flat slab subduction!

• • •

Missing some Tweet in this thread? You can try to force a refresh
 

Keep Current with Alistair Hamill: Connect on LinkedIn & Bluesky

Alistair Hamill: Connect on LinkedIn & Bluesky Profile picture

Stay in touch and get notified when new unrolls are available from this author!

Read all threads

This Thread may be Removed Anytime!

PDF

Twitter may remove this content at anytime! Save it as PDF for later use!

Try unrolling a thread yourself!

how to unroll video
  1. Follow @ThreadReaderApp to mention us!

  2. From a Twitter thread mention us with a keyword "unroll"
@threadreaderapp unroll

Practice here first or read more on our help page!

More from @lcgeography

Feb 10
#HowIUsedGISToday

1/ Using @sentinel_hub EO browser to collect satellite secondary data to explore this week's eruption in Iceland.

This can be a teach from the front lesson or whole class task.
2/ First, open EO Browser (create an account if you don't already have one - the password is remembered by your Chrome account future sign ins).

Search for Iceland and zoom into the Reykjanes Peninsula.
3/ Next, you have to load a satellite image to the base map - in three simple steps:
• Tap search
• Tap on the map
• Tap on the satellite image & it will appear

Drag around to explore.
Read 8 tweets
Nov 11, 2023
1/ Possible (likely?) immanent eruption in the Reykjanes Peninsula, Iceland.

Evidence has been building that another eruption is probable in Iceland, close to the previous eruptions. This thread will follow this developing story.

🧵An unfolding thread🧵 Image
2/ First, what is the evidence over the past weeks and months?

a) Ground deformation
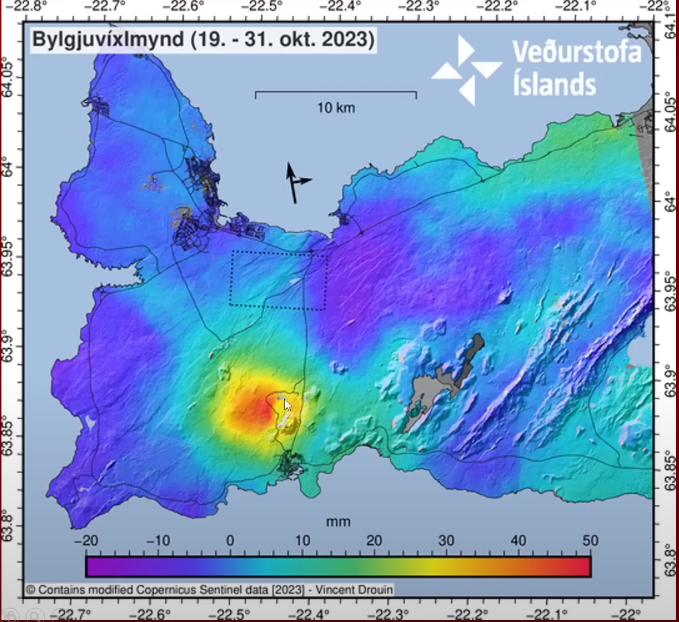
InSAR data reveal significant ground uplift in the region close to the Blue Lagoon, suggesting the upward movement of magma in the crust & towards the surface. Image
3/ This is backed up by GPS data from the region, where a trend in uplift has been observed since mid-October, consistent with the InSAR data.

(There are fluctuations in the graph from ground movement from diurnal & other temperature variations) Image
Read 23 tweets
Feb 6, 2023
An unfolding thread helping us understand the nature of the devastating earthquake affecting Turkey and Syria.

🧵 Image
1/ Size

The main shock at 4.00 am was M 7.8. This is a major quake - there are typically around 15-20 of these globally per year. But the aftershock today was 7.5, much bigger than is typical (which are normally no greater than 1 magnitude less than the main shock).
2/ Depth

The M7.8 quake was only ~ 18 km deep. This is shallow, and it means that much less of the energy released would be attenuated before reaching the surface.

The M7.5 aftershock was even shallower - only 10 km. Image
Read 63 tweets
Jul 27, 2022
1/ #GeographyTeacher quiz!

In the 1960s, Bruce Heezen was one of the first to connect the Mid Atlantic Ridge round South Africa to the Indian Ridge.

But he realised there was a problem: how could the Atlantic & Indian Ocean both be extending if Africa was in the middle? Image
2/ But he was operating with Harry Hess' convection cells model as the mechanism for moving plates: the plates are passive passengers, riding on large convection cells in the mantle. This is how Geoffrey Davies outline's Heezen's logic. Image
3/ Heezen, of course, was wrong: the Earth is not expanding.

So how then do we explain this arrangement of margins?

Here's a slightly wider context. Can you figure out how the plates move to accommodate this arrangement? Image
Read 5 tweets
Jul 19, 2022
1/ There is a social justice dimension to this week's record breaking temperatures in GB, as outlined in this map and article by the BBC. Why does this issue exist and how can we adapt our urban environments to address it?

🧵

bbc.co.uk/news/uk-621264…
2/
3/ This is the story of Jorda, who lives in a top floor flat in London.
Read 8 tweets
Jun 9, 2022
1/ Just started our summer term project with Y13s - a DME about the 2021 Icelandic eruption called 'Can we Stop the Lava?'

Today, it was using GIS to explore the tectonic setting of Iceland & it's relationship to volcanism 60 Ma. in NI!

An ongoing 🧵 Image
2/ We looked at the opening of the North Atlantic over the past 60 Ma.
3/ Then we used a GIS map to explore the pattern of seafloor age. This was followed by a key question: what's the link between this process and the pattern we see?

First steps in getting the pupils to think like scientists and follow the evidence.

Follow this thread for more! Image
Read 10 tweets

Did Thread Reader help you today?

Support us! We are indie developers!


This site is made by just two indie developers on a laptop doing marketing, support and development! Read more about the story.

Become a Premium Member ($3/month or $30/year) and get exclusive features!

Become Premium

Don't want to be a Premium member but still want to support us?

Make a small donation by buying us coffee ($5) or help with server cost ($10)

Donate via Paypal

Or Donate anonymously using crypto!

Ethereum

0xfe58350B80634f60Fa6Dc149a72b4DFbc17D341E copy

Bitcoin

3ATGMxNzCUFzxpMCHL5sWSt4DVtS8UqXpi copy

Thank you for your support!

Follow Us!

:(