Richard 📊📉 Profile picture
Apr 13 7 tweets 4 min read
35,926 new #covid19uk positive tests reported today (13-Apr).

Overall England is DOWN 30% on previous Wednesday and day-1 lateral flow positives are also down by 32%.

This is now the 14th consecutive reporting day of week-on-week drops.
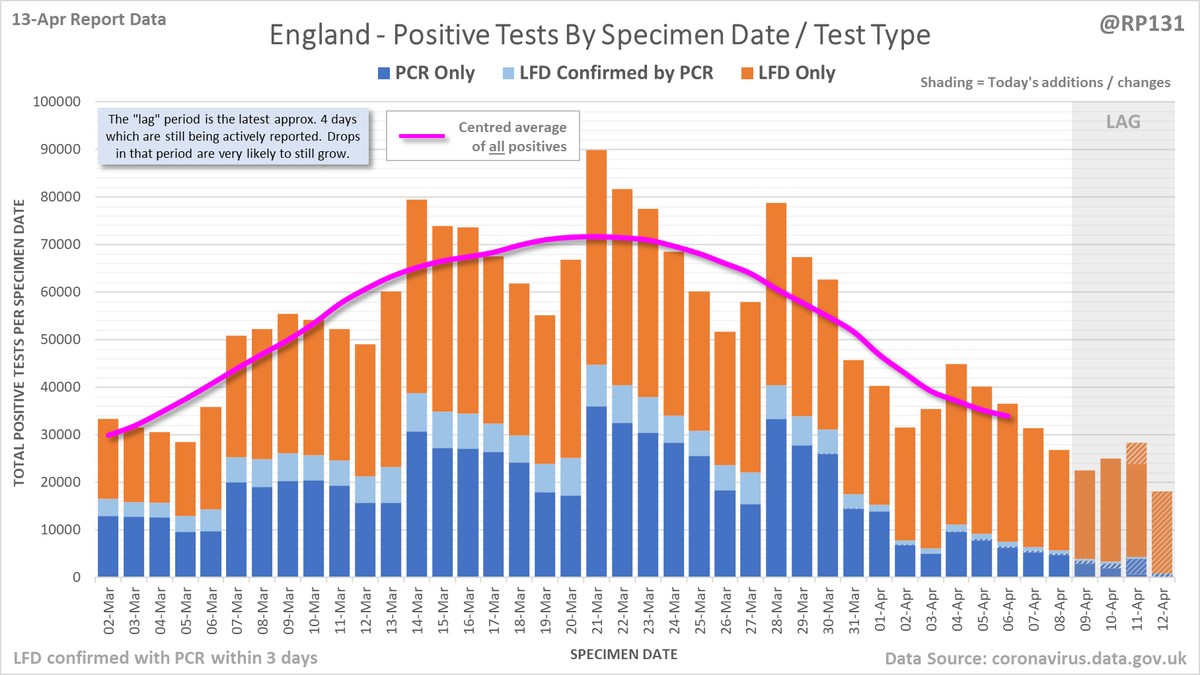
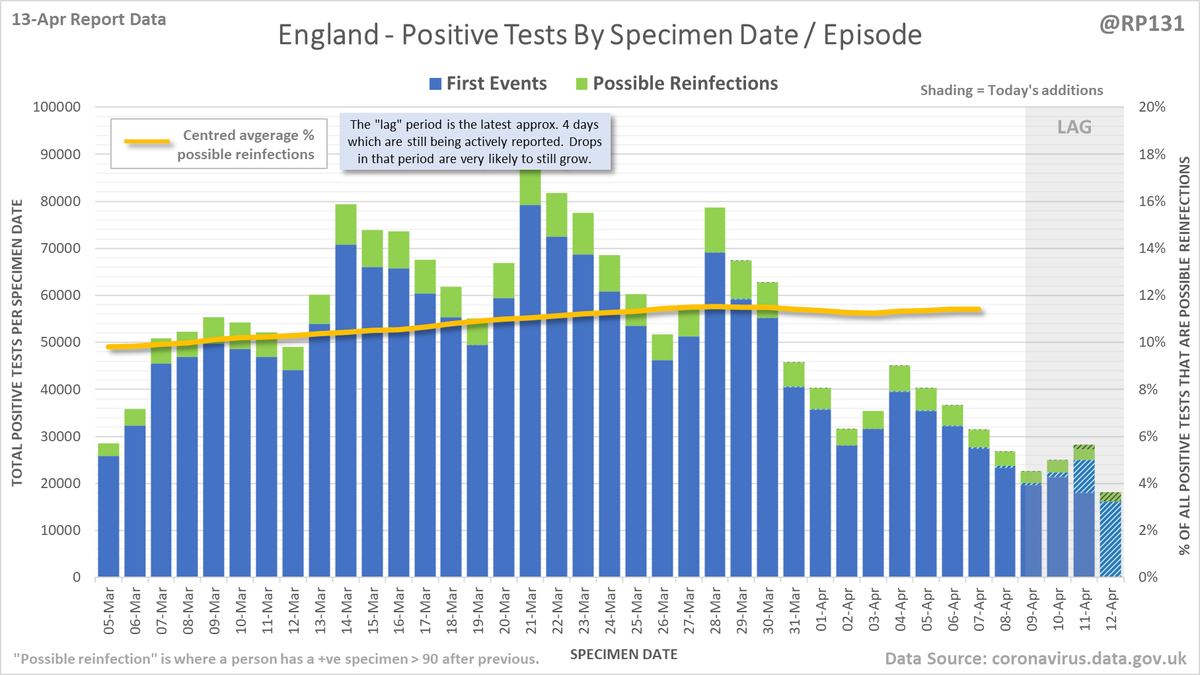
Chart to show England positive tests (as of 13-Apr) by breakdown of first infection events and possible reinfection events.

Possible reinfections were added to the data from 31-Jan and the rolling average vs. total tests is currently about 11%.
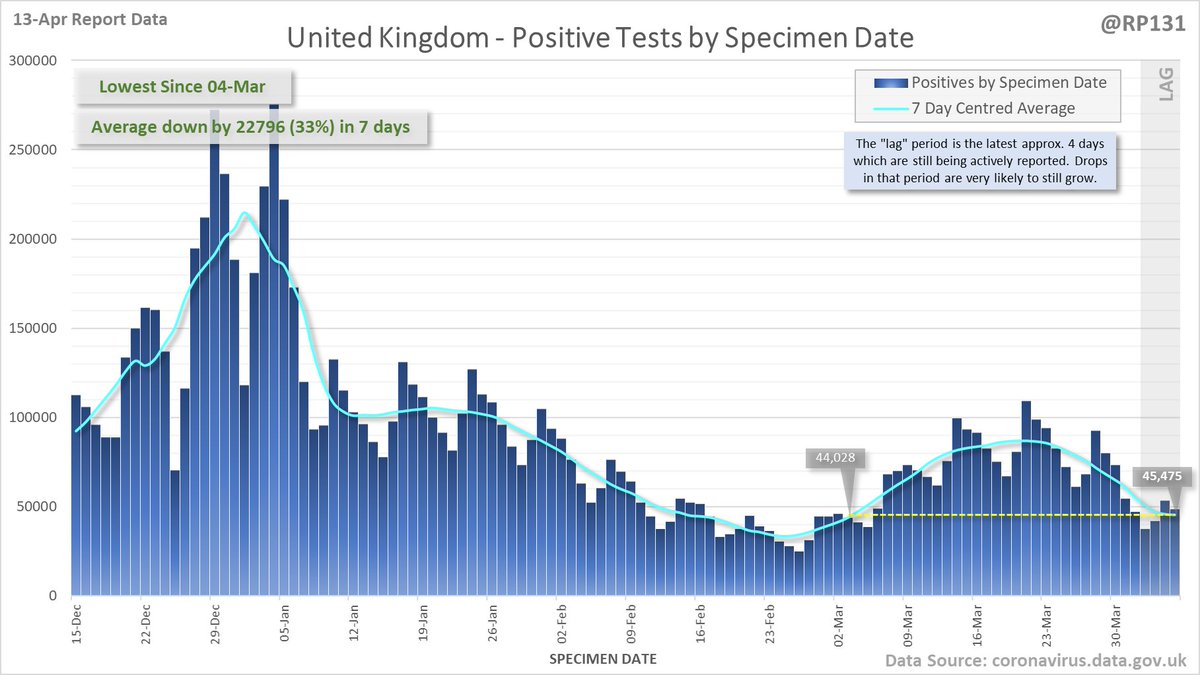
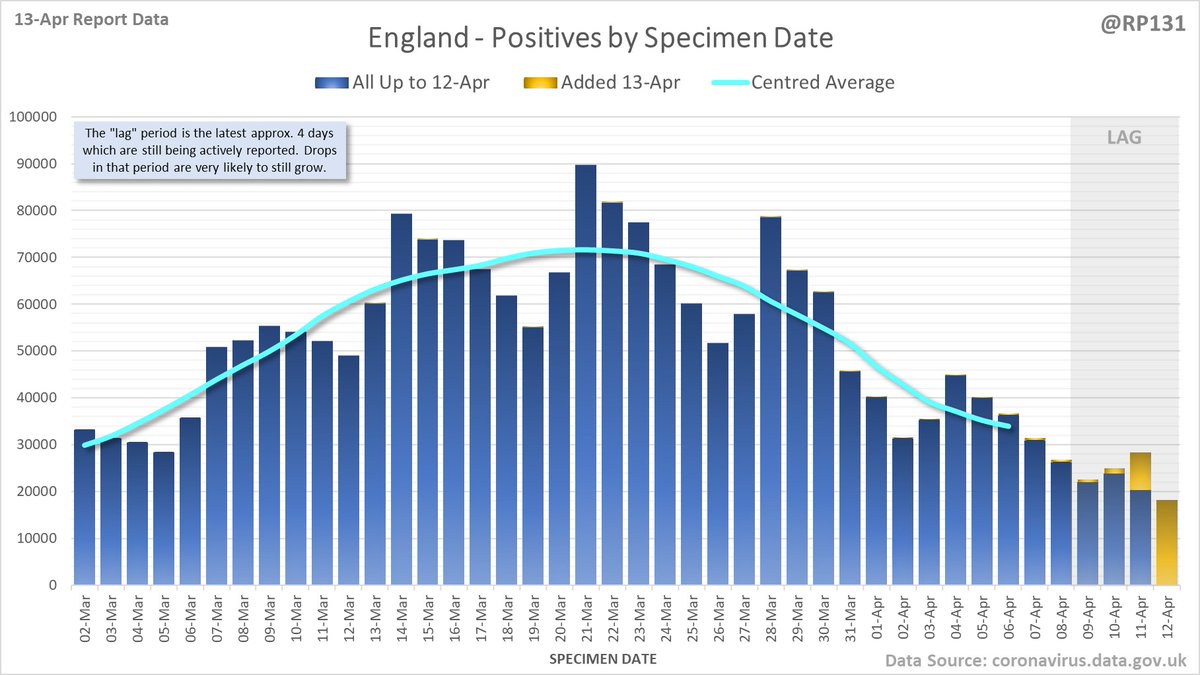
Longer term view. 35,926 new #covid19uk positive tests reported today (13-Apr). This brings the rolling average by specimen date (allowing 4 days for lag) to 45,475, equivalent to around 04-Mar (i.e. 33 days ago), a reduction of 22796 (33%) in the last week.
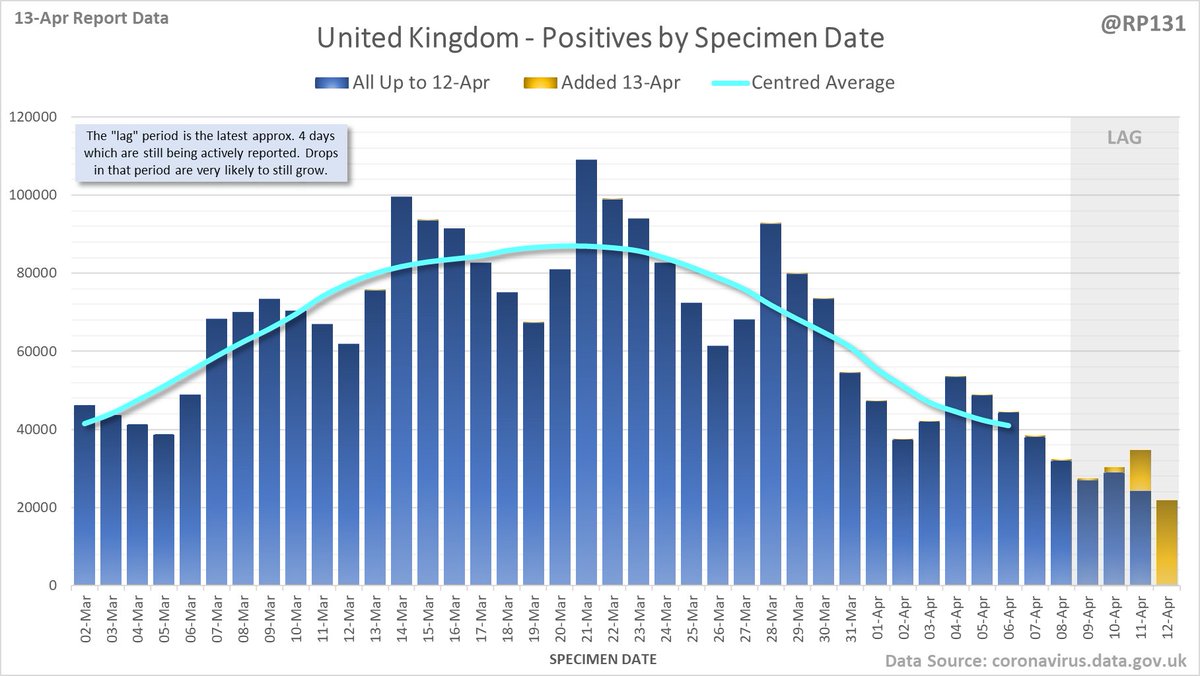
Closer look at the latest 45 days, with today's added numbers highlighted in yellow. Individual nations and animated England charts further down the thread.
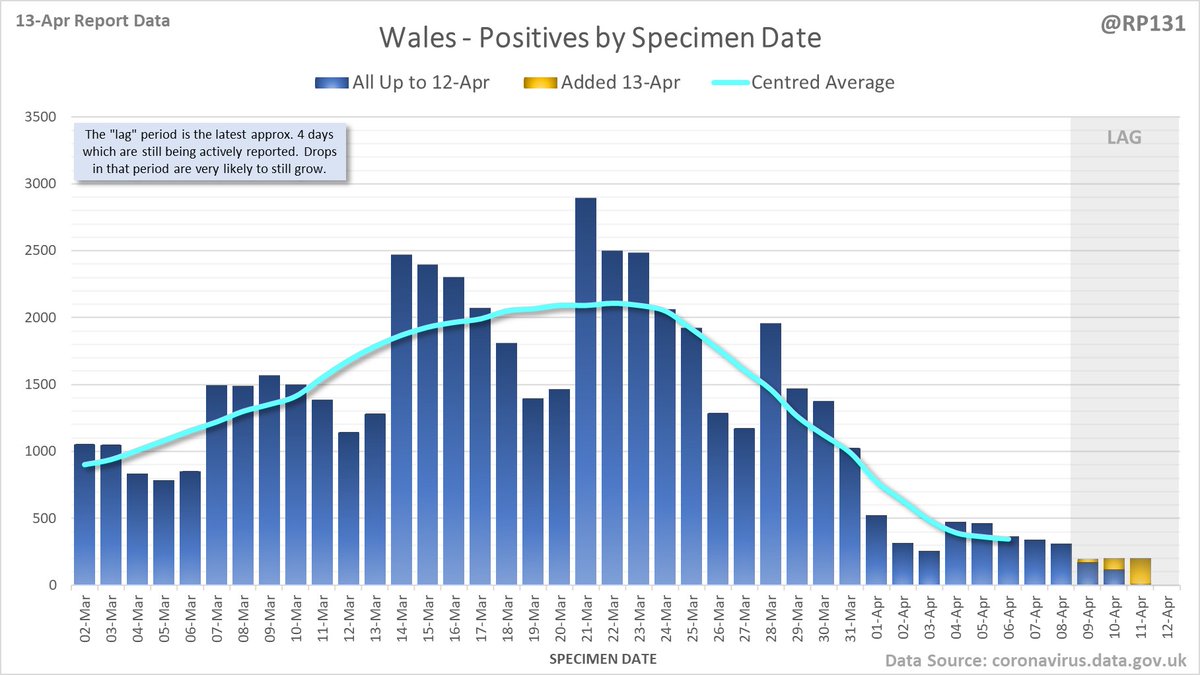
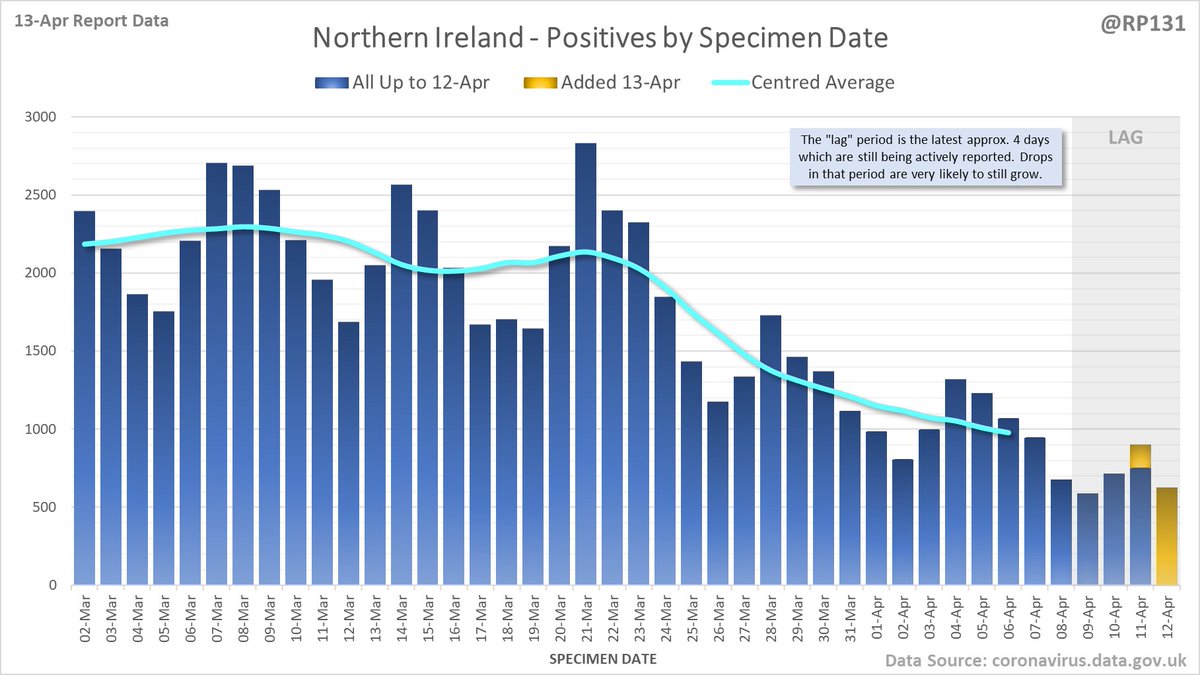
Separate charts for England (29335) Scotland (5513) Wales (308) and Northern Ireland (770). Note the different scales. Also on certain days the specimen-date data for Scotland/Wales/NI doesn't get updated so the yellow bars may be mising or include multiple day's numbers.
Animated chart to show how the #covid19uk positive tests by specimen date have been contributed to by reports over the last 7 days. Note this just includes England numbers as other nations don't always publish their specimen date numbers every day.
Some additional content (mainly variations of the above charts) is available in the full version of the thread here: …ddatashare.s3-eu-west-1.amazonaws.com/Addition/Addit…

• • •

Missing some Tweet in this thread? You can try to force a refresh
 

Keep Current with Richard 📊📉

Richard 📊📉 Profile picture

Stay in touch and get notified when new unrolls are available from this author!

Read all threads

This Thread may be Removed Anytime!

PDF

Twitter may remove this content at anytime! Save it as PDF for later use!

Try unrolling a thread yourself!

how to unroll video
  1. Follow @ThreadReaderApp to mention us!

  2. From a Twitter thread mention us with a keyword "unroll"
@threadreaderapp unroll

Practice here first or read more on our help page!

More from @RP131

Apr 14
350 new #covid19uk deaths reported today (14-Apr). This brings the rolling average by date of death (allowing 4 days for lag) to 240, equivalent to around 30-Mar (i.e. 8 days ago). Image
Closer look at the latest 45 days, with today's added numbers highlighted in orange. Individual nations and animated England charts further down the thread. Image
Longer term charts for England, Scotland, Wales and Northern Ireland. ImageImageImageImage
Read 6 tweets
Apr 14
32,608 new #covid19uk positive tests reported today (14-Apr).

Overall England is DOWN 29% on previous Thursday and day-1 lateral flow positives are also down by 31%.

This is now the 15th consecutive reporting day of week-on-week drops. Image
Chart to show England positive tests (as of 14-Apr) by breakdown of first infection events and possible reinfection events.

Possible reinfections were added to the data from 31-Jan and the rolling average vs. total tests is currently about 11%. Image
Longer term view. 32,608 new #covid19uk positive tests reported today (14-Apr). This brings the rolling average by specimen date (allowing 4 days for lag) to 41,084, equivalent to around 02-Mar (i.e. 36 days ago), a reduction of 23775 (37%) in the last week. Image
Read 7 tweets
Apr 13
651 new #covid19uk deaths reported today (13-Apr). This brings the rolling average by date of death (allowing 4 days for lag) to 244, an increase of 10 (4.2%) in the last week. Image
Closer look at the latest 45 days, with today's added numbers highlighted in orange. Individual nations and animated England charts further down the thread. Image
Longer term charts for England, Scotland, Wales and Northern Ireland. ImageImageImageImage
Read 6 tweets

Did Thread Reader help you today?

Support us! We are indie developers!


This site is made by just two indie developers on a laptop doing marketing, support and development! Read more about the story.

Become a Premium Member ($3/month or $30/year) and get exclusive features!

Become Premium

Don't want to be a Premium member but still want to support us?

Make a small donation by buying us coffee ($5) or help with server cost ($10)

Donate via Paypal

Or Donate anonymously using crypto!

Ethereum

0xfe58350B80634f60Fa6Dc149a72b4DFbc17D341E copy

Bitcoin

3ATGMxNzCUFzxpMCHL5sWSt4DVtS8UqXpi copy

Thank you for your support!

Follow Us on Twitter!

:(