Data Science Dojo Profile picture
Apr 14, 2022 6 tweets 3 min read Read on X
🔎 Learn to create beautiful charts in Python using the Seaborn library: kdnuggets.com/2022/04/data-v…

#Python #DataVisualization #Seaborn
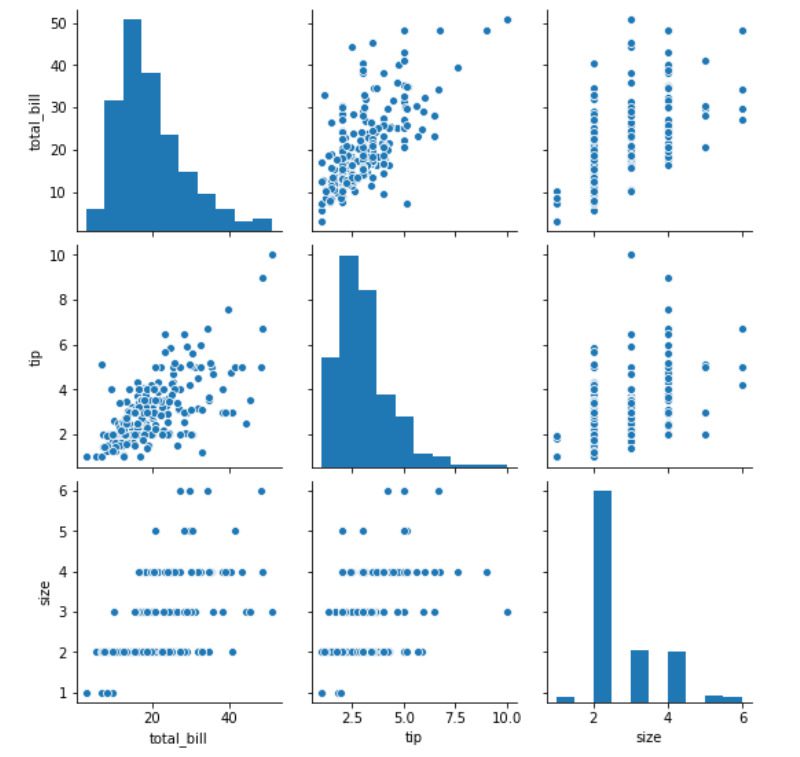
Histogram: The chart above is a simple histogram of the “total_bill” variable. At a glance, we can see that a single meal at this restaurant generally costs around $10 to $25, and there is a positive skew due to some diners ordering more expensive food with prices above $50.
Count Plot: Now, let’s look at the number of male and female diners at the restaurant, to determine the gender that visits the eatery more often.
Bar Chart: Now, let’s try visualizing the relationship between two variables — “sex” and “total_bill” to see if there is a difference in the amount spent by men and women when dining out.
Box plots are a useful way to understand the spread of a variable, and provides us with a five number summary of the data point — minimum, first quartile, median, third quartile, maximum.
A regression plot is the best way to visualize the relationship between two numeric variables. Using Seaborn’s lmplot() function, a regression line is created to demonstrate the correlation between X and Y.

• • •

Missing some Tweet in this thread? You can try to force a refresh
 

Keep Current with Data Science Dojo

Data Science Dojo Profile picture

Stay in touch and get notified when new unrolls are available from this author!

Read all threads

This Thread may be Removed Anytime!

PDF

Twitter may remove this content at anytime! Save it as PDF for later use!

Try unrolling a thread yourself!

how to unroll video
  1. Follow @ThreadReaderApp to mention us!

  2. From a Twitter thread mention us with a keyword "unroll"
@threadreaderapp unroll

Practice here first or read more on our help page!

More from @DataScienceDojo

Oct 24
💡 Most people think prompting is just about typing better questions.

But under the hood, every LLM response is the result of layered context, a delicate interplay between system instructions, your wording, and everything that’s come before in the conversation.

💡 Why it matters:
LLMs don’t just “read” what you say, they interpret it through multiple invisible layers. The system prompt defines who the model is. Your message tells it what to do. And your chat history decides how it should respond now.

Read more 👇

📅 Want to join live?
Register now for the upcoming Agentic AI Bootcamp happening on Nov 25th. Don’t miss your chance to build, test, and evaluate intelligent agents! hubs.la/Q03Q2D3w0

#LLM #PromptEngineering #ContextEngineering #AIUX #AIExplained #GenerativeAI #AIThinkingImage
1️⃣ LLMs don’t just read your prompt.

When you type something into ChatGPT or Claude, it’s not just your question that guides the answer.

There’s a hidden stack of context, from the system’s base instructions to your entire chat history, all working together. Image
2️⃣ Every real LLM prompt has 3 layers:

System Prompt — defines the AI’s persona and rules.

User Prompt — your actual instructions.

Conversation History — everything said before.

Together, they form the “mental state” of the model.
Read 6 tweets
Jun 22, 2023
Data Science Dojo Information Session twitter.com/i/broadcasts/1…
Hello everyone, thank you for joining us today. feel free to post your queries here.
Find all the free tutorials here: hubs.la/Q01kXYd_0
Read 25 tweets
Jun 14, 2023
Building Data Apps with a Codeless Approach twitter.com/i/broadcasts/1…
Hello everyone, thanks for joining, feel free to post your queries here.
Link to the slides: tinyurl.com/DSDojo-KNIME
Read 13 tweets
Apr 19, 2023
Rapid Assessment of Service & Application Security twitter.com/i/broadcasts/1…
Thank you everyone for joining us today, feel free to post your queries here.
Thank you everyone for joining our webinar today. If you're enjoying the session, today make sure to stay tuned with our future webinars, blogs, infographics, and trending data science topics by subscribing to our weekly newsletter: hubs.la/Q01BdYsL0
Read 15 tweets
Mar 30, 2023
Data Science Dojo Information Session twitter.com/i/broadcasts/1…
Thanks everyone for joining. Feel free to post your questions here in the comment section.
Find all the free tutorials here: hubs.la/Q01kXYd_0
Read 23 tweets
Mar 28, 2023
Building Robust Machine Learning Models from Noisy Labeled Data twitter.com/i/broadcasts/1…
Thank you everyone for joining our webinar today. If you're enjoying the session, today make sure to stay tuned with our future webinars, blogs, infographics, and trending data science topics by subscribing to our weekly newsletter: hubs.la/Q01BdYsL0
Follow us on Instagram for data science sliders, infographics, memes, and short videos: hubs.la/Q01Bd-8v0
Read 11 tweets

Did Thread Reader help you today?

Support us! We are indie developers!


This site is made by just two indie developers on a laptop doing marketing, support and development! Read more about the story.

Become a Premium Member ($3/month or $30/year) and get exclusive features!

Become Premium

Don't want to be a Premium member but still want to support us?

Make a small donation by buying us coffee ($5) or help with server cost ($10)

Donate via Paypal

Or Donate anonymously using crypto!

Ethereum

0xfe58350B80634f60Fa6Dc149a72b4DFbc17D341E copy

Bitcoin

3ATGMxNzCUFzxpMCHL5sWSt4DVtS8UqXpi copy

Thank you for your support!

Follow Us!

:(