
🧵Adding Scalps Thread🧵
🔫Easy Read, Enjoy!🔫
🔫Easy Read, Enjoy!🔫
(1/14) I like to look to add my scalps based on a few indicators. To start off, I like to watch the 1M chart with 1M volume bars. I aim to scale within 10 minutes.
(2/14) First, I like to chart the high and the low of the last 10 minutes. Once I chart these lines, I calculate an approximate range of where the current share price is.
(3/14) Example 
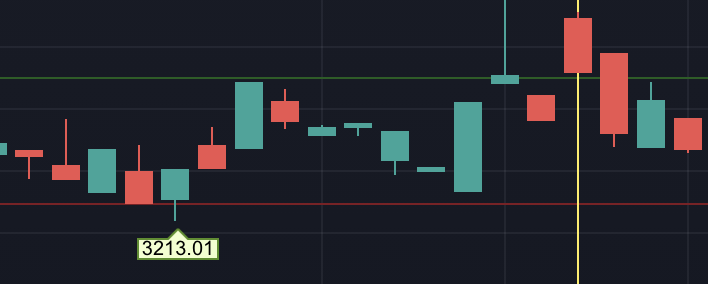
(4/14) When I am looking at calls, I like to see them about 25-30% in this range. When I am looking at puts, I like to see them about 75-70% in the range. I like this because it leaves room for stocks to move without breaking a level.
(5/14) With this strategy, stocks often blow up in my face, it’s important for me to remember there is plenty of opportunity and no need to chase stocks out of my zone.
(6/14) Next, I like to watch for bullish and bearish trends. I like to see higher lows for bullish trends and lower highs for bearish trends. I like to see at least 3 candles (3M) before I can consider it a trend.
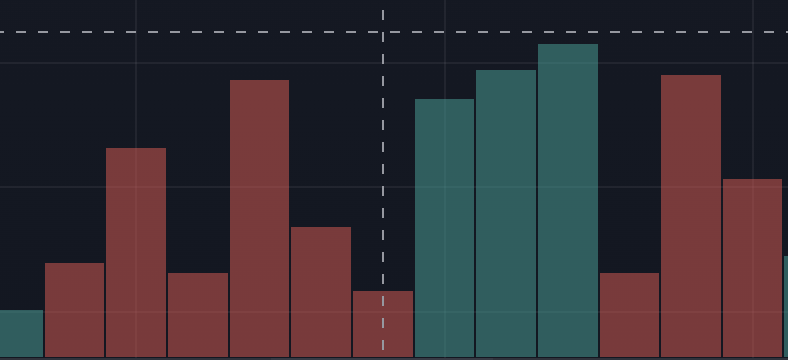
(7/14) Then, I like to see that the volume is constant. To quickly check this, I like to watch the 1M volume bars and compare the sizes. I can conclude the volume is inconsistent when some candles are tall while others are short
(8/14) Consistent

(9/14) Not Consistent
(10/14) Before entering, I check
H/L on the stock
H/L on the contract
Volume on contract, OI, IV
H/L on the stock
H/L on the contract
Volume on contract, OI, IV
(11/14) I like to check the high and low of the day on both the contract and the stock. This helps me determine how much room the contract can have both ways. This can also help me get a better understanding of the contracts sensitivity to the share price.
(12/14) I also like to make sure there is volume for the day on the contract along with some open interest. I check for these to make sure there is liquidity.
(13/14) Finally, I like to check the IV. Implied Volatility represents a forecast of how far the contract can move. I don’t necessarily avoid high IV trades, I like to be aware of the IV before entering to avoid unexpected IV drops.
(14/14) Thank you for taking the time to read! Hope you enjoyed it! Be sure to Like, Retweet and Follow for more! Plenty more threads on the way!❤️
• • •
Missing some Tweet in this thread? You can try to
force a refresh


