
NEW: for this week’s column I dug into the curious case of British attitudes to immigration
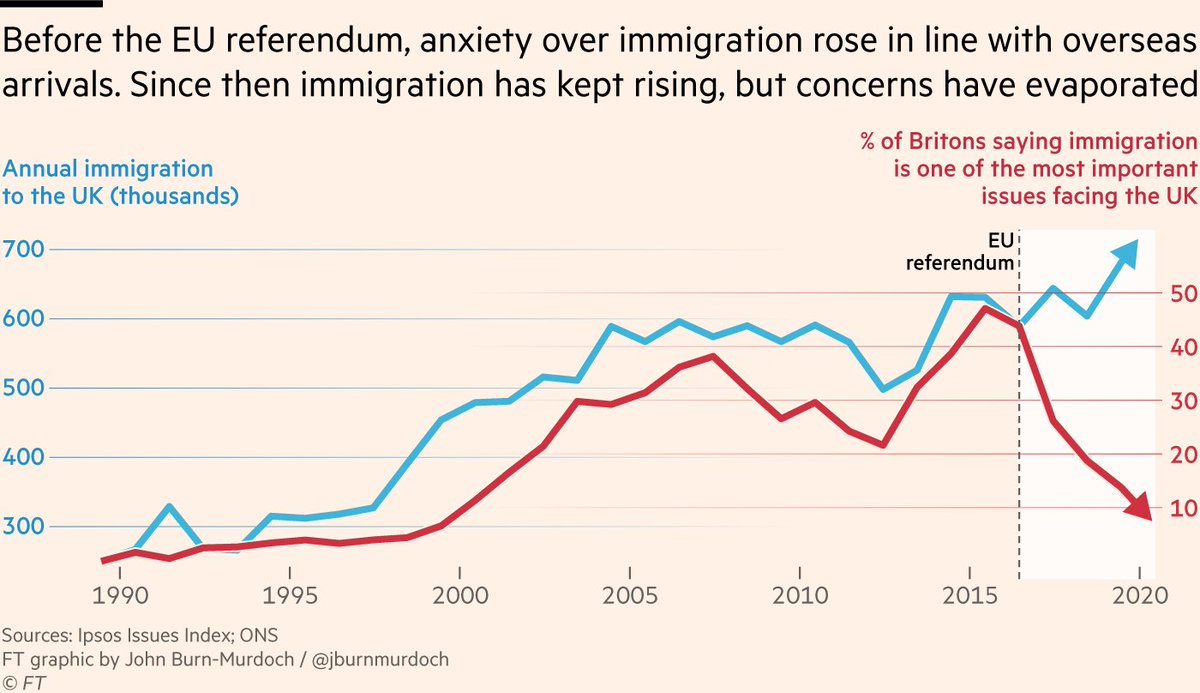
Before the EU ref, concern about immigration tracked levels of arrivals. Since then, immigration has kept rising but concerns have evaporated
What’s going on?
ft.com/content/f2d72f…
Before the EU ref, concern about immigration tracked levels of arrivals. Since then, immigration has kept rising but concerns have evaporated
What’s going on?
ft.com/content/f2d72f…
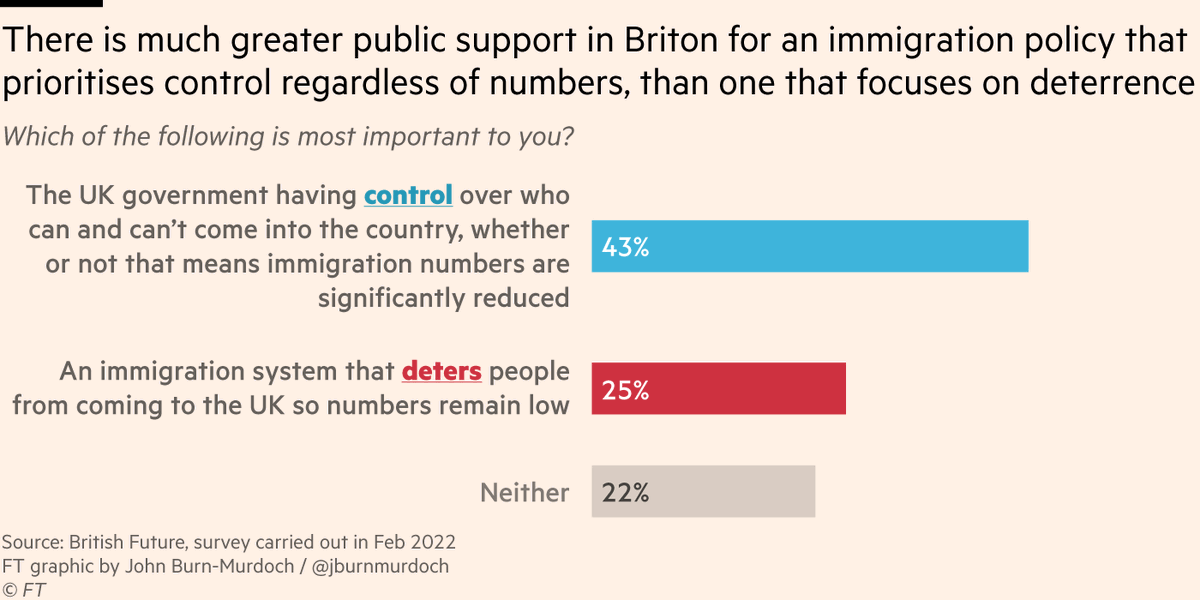
One theory is Brits’ views on immigration were always more than a simple numbers game, and it was *having control* over who comes in that really mattered to the immigration-anxious, rather than the numbers themselves.
Polling by @sundersays @britishfuture seems to bear this out.
Polling by @sundersays @britishfuture seems to bear this out.
Linked to this is Brits’ growing appreciation of immigrants as contributors — performing critical jobs etc — rather than competitors for "British jobs" or adding pressure on public services
Views of immigrants’ impact on NHS are illustrative: flipped from 👎 to 👍 since 2012
Views of immigrants’ impact on NHS are illustrative: flipped from 👎 to 👍 since 2012

And this chart is particularly striking:
Ten years ago, 60% of Brits saw immigrants as "taking away jobs", hampering the economic recovery.
Today, 60% see immigrants as providing vital skills and labour to drive the economic recovery.
A complete reversal 🔁
Ten years ago, 60% of Brits saw immigrants as "taking away jobs", hampering the economic recovery.
Today, 60% see immigrants as providing vital skills and labour to drive the economic recovery.
A complete reversal 🔁

This goes hand-in-hand with the preference for a policy focused on control rather than on deterrence.
If you see immigrants as a threat/strain, you want numbers reduced. If you see them as a vital part of society, reducing numbers makes no sense; filling jobs becomes priority.
If you see immigrants as a threat/strain, you want numbers reduced. If you see them as a vital part of society, reducing numbers makes no sense; filling jobs becomes priority.
And while the EU referendum result may have taken the air out of Brits’ concerns seemingly overnight, attitudes have been warming steadily for well over a decade now.
This year, for the first time since records began, Brits who want immigration reduced are in a minority ‼️
This year, for the first time since records began, Brits who want immigration reduced are in a minority ‼️

We see a similar pattern with other questions:
A clear majority now say immigrants have a positive impact on the British economy, and that they enrich British culture.
This is again a complete reversal from a decade ago, and has been a continuous positive trend.
A clear majority now say immigrants have a positive impact on the British economy, and that they enrich British culture.
This is again a complete reversal from a decade ago, and has been a continuous positive trend.

It’s also useful to look at the international context:
British attitudes towards immigrants today rank among the most positive globally.
To be clear, "better than other places" absolutely does not mean "beyond reproach", but the context is still worth noting.
British attitudes towards immigrants today rank among the most positive globally.
To be clear, "better than other places" absolutely does not mean "beyond reproach", but the context is still worth noting.

So, is the UK now a high-immigration, pro-immigration country, with attitudes trending inevitably more positive?
Well, for that we must revisit the chart that began this thread:
Immigration has kept rising but concerns have evaporated. What *else* could explain the divergence?
Well, for that we must revisit the chart that began this thread:
Immigration has kept rising but concerns have evaporated. What *else* could explain the divergence?

And this is where the picture grows a little more ominous for us liberals:
Public concern may have tracked immigration levels relatively well pre-referendum, but it tracked tabloid coverage (here the Daily Mail) even better, and *has continued to track it* post-referendum ⚠️
Public concern may have tracked immigration levels relatively well pre-referendum, but it tracked tabloid coverage (here the Daily Mail) even better, and *has continued to track it* post-referendum ⚠️

So while all the evidence suggests British attitudes towards immigrants are warming substantially, there is a looming risk that if certain politicians and parts of the media were to once again fan the flames of anti-immigrant sentiment, public concern could be coaxed back upwards
There is some cause for tentative optimism, though.
Here’s that same chart updated for 2022: tabloid coverage of immigration has ticked up again, but as of yet public concern is not following its lead.
Here’s that same chart updated for 2022: tabloid coverage of immigration has ticked up again, but as of yet public concern is not following its lead.

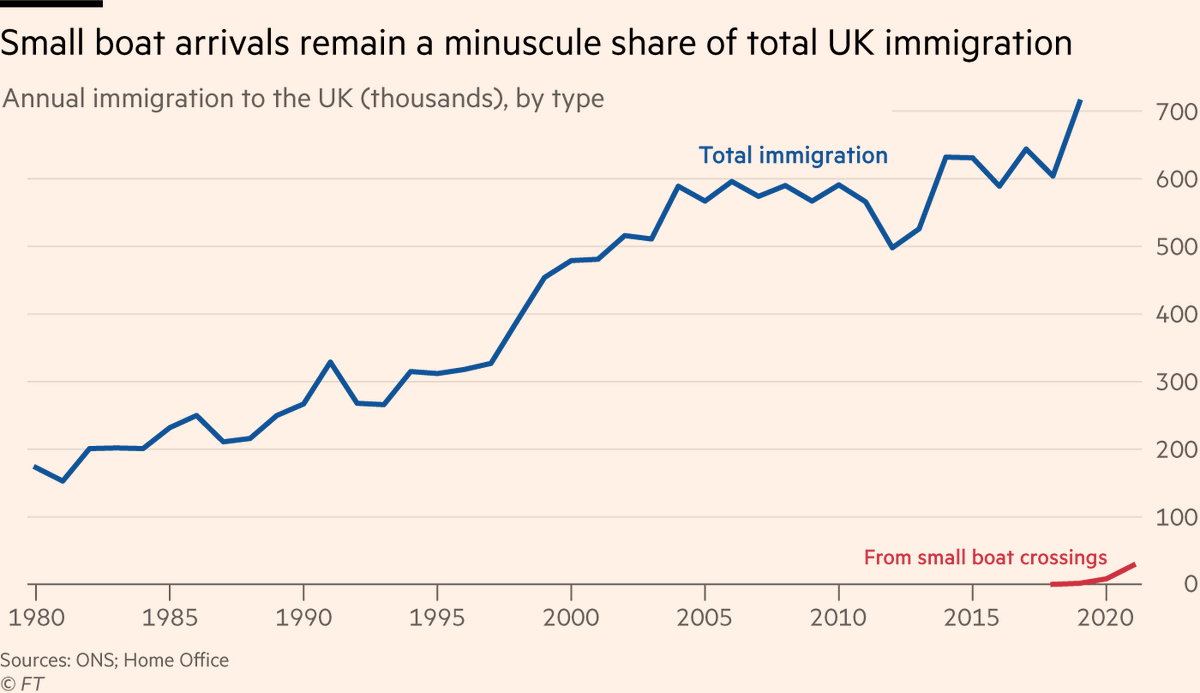
One possible explanation is that the new object of the tabloids’ focus — small boats crossing the Channel — doesn’t hit as hard as their pre-referendum campaigns, for a number of reasons.
First, arrivals on small boat crossings represent only a tiny, tiny portion of immigration.
First, arrivals on small boat crossings represent only a tiny, tiny portion of immigration.
And while people are certainly anxious about the topic of small boat crossings — in significant part out of concern for the migrants’ safety — Britons generally sympathise with the asylum seekers and most do not favour a deterrence approach.

But another reason public concern is not following tabloid coverage could be that immigration concerns are being crowded out by topics like cost of living crisis and Ukraine.
Certainly it would be naive to assume the recent drop in concern is a one-way street and here to stay.
Certainly it would be naive to assume the recent drop in concern is a one-way street and here to stay.
So to summarise:
• Brits’ concerns with immigration have plummeted despite immigration continuing to rise
• This coincides with a steady and ongoing positive trend in views towards immigrants
• But renewed tabloid focus on immigration could change things
• Brits’ concerns with immigration have plummeted despite immigration continuing to rise
• This coincides with a steady and ongoing positive trend in views towards immigrants
• But renewed tabloid focus on immigration could change things
Here’s the column: ft.com/content/f2d72f…
A few more related bits and pieces:
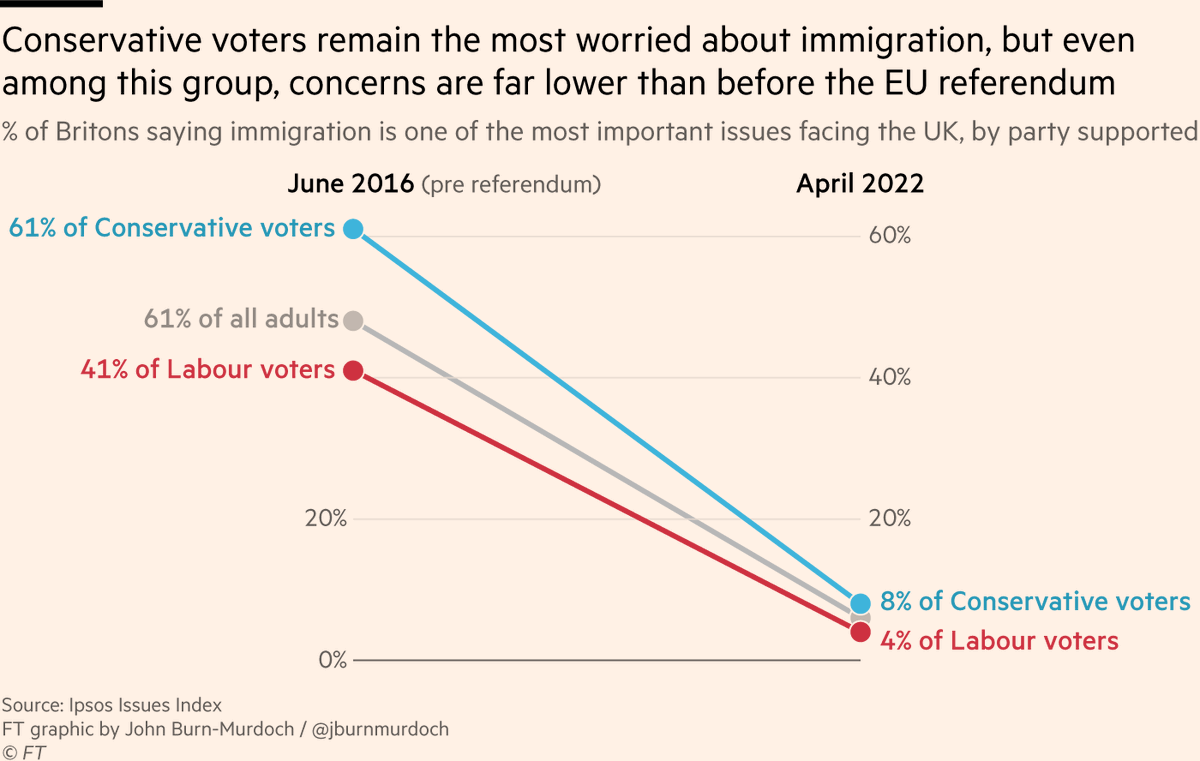
First, @stephenkb points out that although concern about immigration has plummeted, concern among Tory voters is higher.
Stephen is of course correct, but that higher concern is still just 8%, down from 61% (!) pre-ref ft.com/content/f2265d…
First, @stephenkb points out that although concern about immigration has plummeted, concern among Tory voters is higher.
Stephen is of course correct, but that higher concern is still just 8%, down from 61% (!) pre-ref ft.com/content/f2265d…
Second, it’s striking how people’s perceptions of immigration levels are driven by their fears, and that applies just as much on the left as the right.
The group least likely to recognise that immigration to the UK has risen since Brexit are ... pro-immigration Remainers!
The group least likely to recognise that immigration to the UK has risen since Brexit are ... pro-immigration Remainers!

Third, please do read the various other excellent pieces on this topic, such as @samfr’s read for @prospect_uk last week prospectmagazine.co.uk/politics/has-b… ...
@jameskirkup’s piece for the Times a couple of weeks back thetimes.co.uk/article/the-go…
The various excellent pieces of research on this topic from @UKandEU contributors including
• @sundersays ukandeu.ac.uk/immigration-a-…
• @robfordmancs ukandeu.ac.uk/immigration-is…
• @Heather_Rolfe ukandeu.ac.uk/public-attitud…
• @jdportes ukandeu.ac.uk/immigration-af…
• @sundersays ukandeu.ac.uk/immigration-a-…
• @robfordmancs ukandeu.ac.uk/immigration-is…
• @Heather_Rolfe ukandeu.ac.uk/public-attitud…
• @jdportes ukandeu.ac.uk/immigration-af…
And the brilliant paper from @jon_mellon and Geoff Evans that first looked at the links between public concern about immigration, actual immigration levels, and tabloid coverage of immigration journals.sagepub.com/eprint/s369sKr…
Finally, it’s interesting to ponder what all of this means for the government’s Rwanda policy:
Aside from its vast expense, impracticality and risk of exacerbating the problem it seeks to solve (see below), it also draws attention to a factor over which the government does not have any control
https://twitter.com/Samfr/status/1523790881194582017
It’s possible — likely even? — that the government doesn’t care that it won’t work, because it sees the policy primarily as 'vice signalling'.
Just signal to anti-immigrant voters that you’re being hostile to asylum seekers, even if it’s all bark and no bite.
Just signal to anti-immigrant voters that you’re being hostile to asylum seekers, even if it’s all bark and no bite.
But the problem is that all you may actually be doing is:
• Pissing off all the people who see the policy as inhumane
• Pissing off all the people who see the policy as expensive/ineffective
• Pissing off all the anti-immigration people who see it as failing to work
• Pissing off all the people who see the policy as inhumane
• Pissing off all the people who see the policy as expensive/ineffective
• Pissing off all the anti-immigration people who see it as failing to work
• • •
Missing some Tweet in this thread? You can try to
force a refresh


