I've been playing with the #REF2021 data - the massive, funding-defining, UK research assessment exercise which provides a (faulty-metric defined) glimpse of structure, size and inequality in UK University research system.
The data is open results2021.ref.ac.uk
The data is open results2021.ref.ac.uk
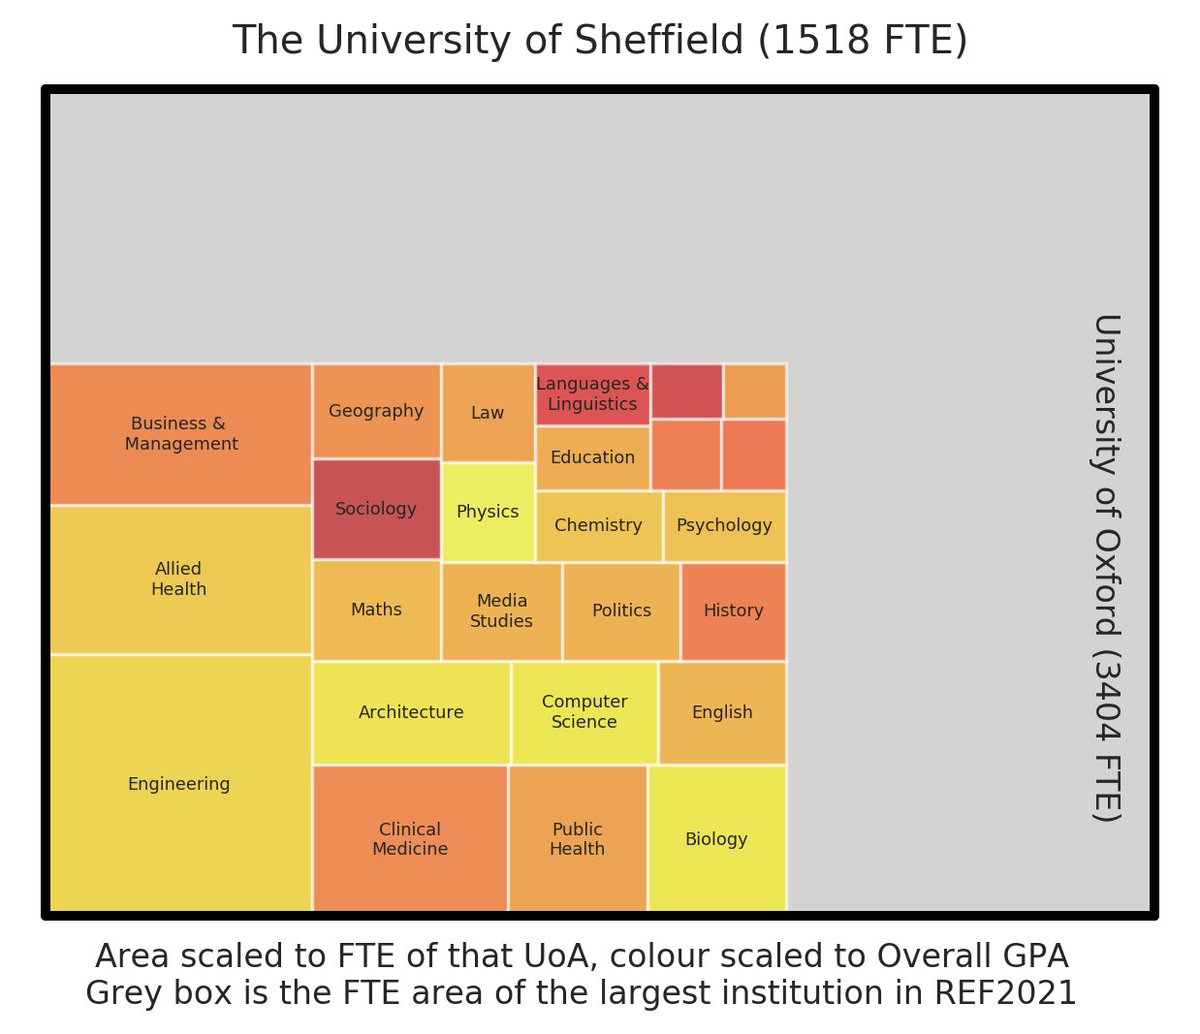
To visualise each institution's research make a square for each discipline/department they submitted ("UoAs"), scaled by the staff in that UoA, and coloured by the GPA that unit received for their research ("hot" colourmap - more white/yellow is numbers closer to 4, the maximum)
Here's the visualisation for University of Oxford, 3404 staff FTE, the largest in the #REF2021 

Every other institution submitted fewer research staff, so they are represented by smaller squares. Here is the University of Sheffield, with the scale of Oxford shown in grey 

22 institutions submit >1000 researchers to the REF. Most of the 158 institutions in REF are much smaller. Here is one, Sheffield Hallam University 

Ordering institutions small to large, we can put these together in a 80 second video which gives something of an impression of UK University research according to #REF2021
Caveat: not all that is measured matters, not all that matters can be measured
Caveat: not all that is measured matters, not all that matters can be measured
For the code to make these, plots for all individual institutions and slower versions of the video, see github.com/tomstafford/re…
Thanks to @emilynordmann and @sharoz for advice about plotting
Thanks to @emilynordmann and @sharoz for advice about plotting
Tweet me your institution and I'll send you the relevant plot
More caveats: proportional area and colormaps are TWO dataviz practices which are notorious for encouraging misinterpretation
Also, no code is error free, definitely not mine, so let me know if something seems off
More caveats: proportional area and colormaps are TWO dataviz practices which are notorious for encouraging misinterpretation
Also, no code is error free, definitely not mine, so let me know if something seems off
Linking in a couple of other #REF2021 threads
https://twitter.com/tomstafford/status/1525453752299315204
• • •
Missing some Tweet in this thread? You can try to
force a refresh


