Going thru charts, these 5 stood out: 
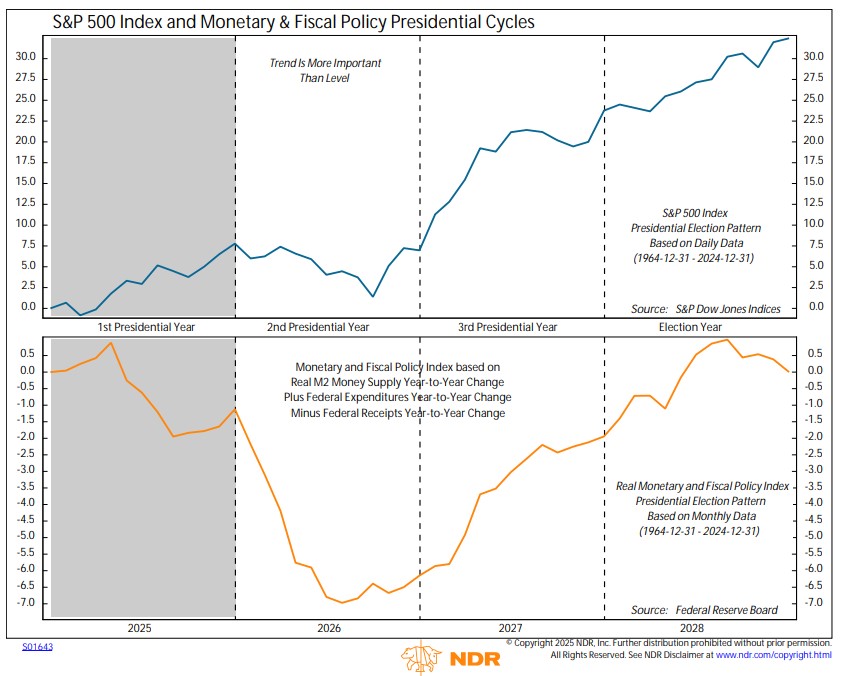
1. Hearing comments like "rates are only at 1%. Wait til the Fed really tightens." But that doesn't capture what's happening now. @NDR_Research Monetary, Fiscal & Exchange Rate Policy Index is dropping at fastest rate since at least 1974. 1/5
2. FY22 #earnings estimates have finally started to drop as analysts accept reality that double digit EPS growth will be hard to achieve amid a slowing economy, tightening policy, rising wages, and high inflation. 2/5
3. By quarter, EPS #estimate decline more in Q1 and Q2 than Q3 and Q4. In last 3 weeks, Q1 21 SPX #EPS estimate -$1.75 (reporting now), Q2 -$0.88, Q3 -$0.34, Q4 -$0.28. So...risk remains to the downside. 3/5
4. Technically, the market is deeply oversold. $SPX 14-day stochastic hit lowest level since 12/24/2018. Just an observation, not a recommendation (I don't like catching falling knives.) 4/5
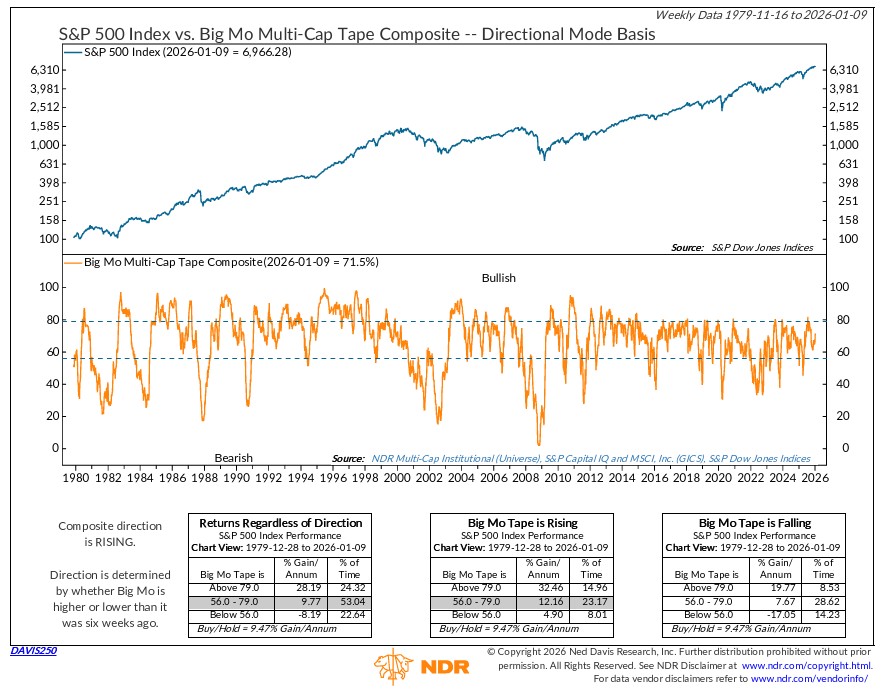
5. @NDR_Research Trading Sentiment Composite in extreme pessimism zone, but it's worth noting that it has not fallen to levels seen in at Ukraine invasion in Feb, let alone March 2020. 5/5
• • •
Missing some Tweet in this thread? You can try to
force a refresh
A 🧵on the election and markets:
Biden/Trump is a rematch no one wants, but Biden in particular has an approval rating issue. At 41%, he has the lowest of any president seeking reelection at this point in the year. The median for incumbents who won is 55%. @NDR_Research 1/5
Taking Biden's reelection bid out of the equation, presidential approval acts like any sentiment indicator. A low % implies pessimism, which tends to be bullish for stocks.
For approval rating there's a "no bad it's bad" zone but Biden's approval would need to fall 6 points. 2/5
The start of election years tends to be weak. Stocks have done better when the incumbent party has gone on to retain the White House. It's a chicken-and-egg argument. A strong economy helps stocks and therefore helps the incumbent. 3/5
The Fed is preparing the markets for a rate cut. Cuts have been bullish on avg. The DJIA has been flat before the 1st cut & up 15% a year later.
Context matters, esp. vs the economic cycle. (Btw, we use the DJIA for more history but trends are similar w/SPX). @NDR_Research 1/5
When the Fed has avoided recession, stocks have ripped higher, +24% 1 yr later.
When the economy has been in recession within a year of the 1st cut, the DJIA has weak beforehand but +10% 1 yr later. Most of the gains came in months 8-12. Why? Again, context matters. 2/5
Historically the Fed waited until near the end of the recession, after much of the damage was done.
When the Fed cut early in recession, stocks were mixed for months before rallying.
When the Fed cut before recession, the DJIA fell for 10 more months, on avg. 3/5
We're entering the ❤️ of earnings season, so here's a 🧵on where we are in the cycle. 1. The bull market has left the early sentiment-driven phase when "P" rises > "E" and entered the earnings-driven phase (e.g., EPS growth needed for bull to continue). @NDR_Research 1/6
@NDR_Research 2. SPX trades not off EPS growth but the change in the growth rate. Consensus is calling for EPS growth to accelerate in CY24, which would be bullish.
Investors have learned that analysts are often too optimistic, so it's TBD if their positive outlook comes to fruition. 2/6
3. A risk to consensus estimates are that they are back-end loaded. Single quarter y/y SPX operating EPS growth is expected to spike from <10% in Q1 & Q2 to 20% in Q3 & 18% in Q4. Comps play a role but that's baking in a soft/no landing scenario. 3/6
We published our 23 charts of 2023. A sample: 1. File 2023 under the market doing what is needed to prove the majority wrong. Recession and new lows were consensus in Jan. Not only did econ data exceed expectations, but the economy grew ⬆️trend & SPX gained 24%. @NDR_Research 1/5
2. Partly due to the dour economic outlook, the market was ahead of the Fed in expecting rate cuts. A year ago fed funds futures expected the first cut in mid-2023. Powell followed through on his promise for higher for longer and is preparing for a mid-2024 first cut. 2/5
3. Most surprising chart of the year? With focus on the Fed, many missed the massive fiscal stimulus. An 8.8% social security COLA increase, lower capital gains taxes, filing delays, and interest expenses contributed to the biggest policy stimulus outside war or recession. 3/5
If the last 8 months felt weird to you, well, you're right. The $SPX rose for 5 straight months then fell for 3 straight months for only the 4th time on record. 2 came at the start of cyclical bulls (2016 & 1975) & 1 occurred during the ultra-long 1939-42 bear. @NDR_Research 1/7
What happened after the 3rd down month? A resumption of the uptrend has been more common than a continuation of the recent downtrend.
We expanded the study to include 4 up months. Results similar. SPX posted strong gains up to 12M later on avg. Last 50 yrs, up every time. 2/7
Breadth was terrible during the correction. % of stocks above their 200-day moving averages fell as low as 26.7%. This week's rally triggered an oversold breadth signal. 3/7
Lots of talk about 2023 a lot like 1987:
-big ⬆️ yr +Q3 drop
-poor breadth
- inflation & rates ⬆️/hawkish Fed
-USD 💪
A closer look reveals several differences: 1. $SPX MUCH stronger in 1987. +39% at highs vs +21% in 2023. 1987 was yr 3 of bull vs yr 1 in 2023 @NDR_Research 1/9
2. Breadth weak in Q3 in both years. A big difference is in 2023, several breadth gauges made new cycle highs on summer rally. They failed to confirm in summer of 1987.
On a negative note, new lows worse in 2023 than 1987. 2/9
3. Rising rates were a theme both years. But...
-T-bills rose almost 2x as much with most in 2H 87
-Yields higher across the curve in 1987
-Yield curve was upward sloping vs deeply inverted in 2023.
We can debate how to interpret, but bottom line is rate regimes differed. 3/9