AAPI Data Profile picture
Jun 3 15 tweets 19 min read
#AsianAmerican and #PacificIslander communities are among the most dynamic populations in the U.S. Today, @AAPIData released the latest available demographic data, and it is CHOCK FULL of important findings! 🧵and link aapidata.com/reports/ #DataEquity #AAPI #WhoWeAre State of Asian Americans, Native Hawaiians, and Pacific IslaA chart depicting growth rate by race alone or in combinatioA chart depicting persons obtaining legal permanent residentA chart depicting percentages of the population by race alon
Between 2010 and 2020, the Asian American pop grew rapidly by 40% to over 24M. The Native Hawaiian and Pacific Islander population also grew by 30% to 1.6M #DataEquity #AAPI #WhoWeAre A chart depicting growth rate by race alone or in combinatio
Indians are now the second largest Asian population in the United States, passing Filipinos #DataEquity #AAPI #WhoWeAre A chart depicting population by detailed Asian national origThis chart depicts growth rates from 2010 - 2020 by detailedThis chart depicts population by detailed NHPI national origThis chart depicts growth rates from 2010-2020 by detailed N
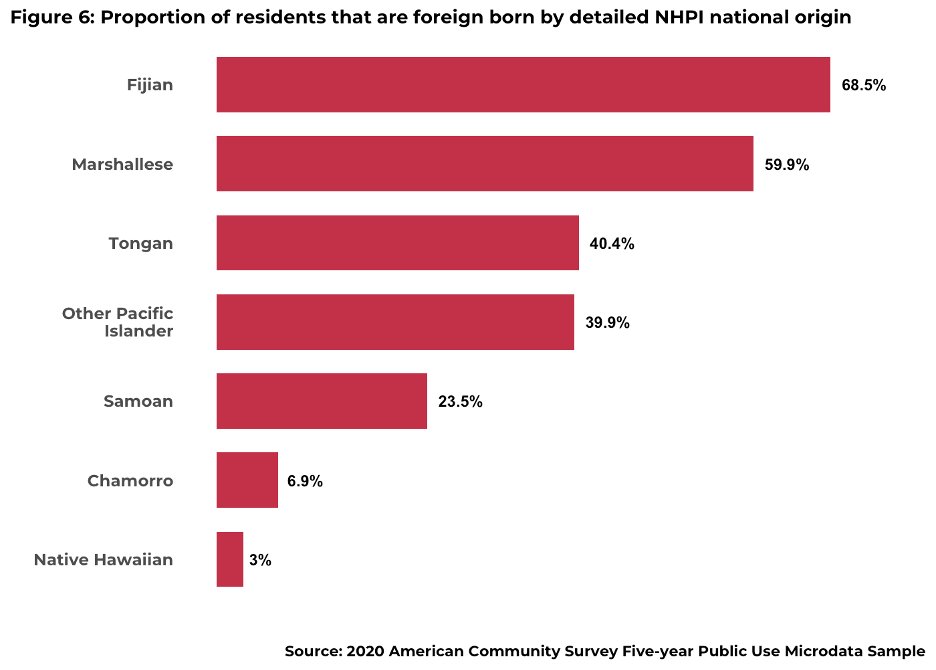
Most Hmong are now native-born, joining Japanese as the only other majority native-born AA group. For Pacific Islanders, Fijians and Marshallese are majority foreign-born #DataEquity #AAPI #WhoWeAre This chart depicts the foreign-born population by detailed AThis chart depicts the percentage of residents that are fore
Fewer legal permanent residency permits were issued to Asian and Latin American immigrants during the final two years of the Trump administration, and fewer Asians were naturalized in 2020 #DataEquity #AAPI #WhoWeAre A chart depicting persons obtaining legal permanent residentA chart depicting persons obtaining legal permanent residentA chart depicting persons naturalized by region and fiscal yA figure depicting persons naturalized for selected Asian co
Family sponsorships declined as a share of green cards for Asian immigrants during the final year of the Trump administration when compared to the final year of the Obama administration #DataEquity #AAPI #WhoWeAre A figure depicting persons obtaining legal permanent residen
Asian Americans are the most likely to speak a language other than English at home (74%) when compared to Latinos (71%) and Native Hawaiian and Pacific Islanders (41%) #DataEquity #AAPI #WhoWeAre A chart depicting percent who speak a language other than En
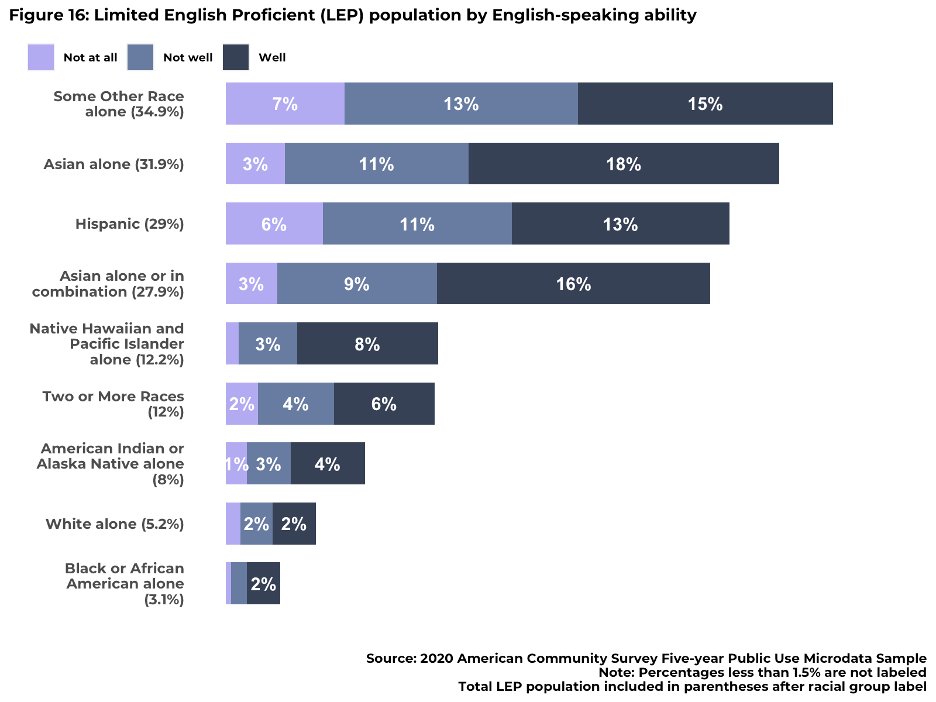
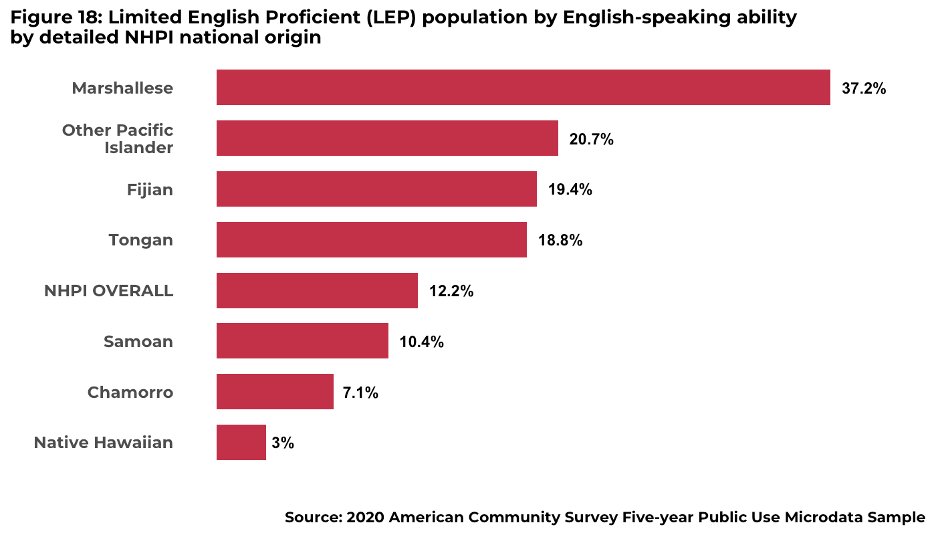
Asian Americans have the most language assistance need with 32% being Limited English Proficient compared to 29% for Latinos and 12% for Native Hawaiians and Pacific Islanders #DataEquity #AAPI #WhoWeAre A chart depicting percentages of the population by race alonA chart depicting the percentage of the population that are This chart depicts the limited English proficient population
NHPIs continue to face the greatest challenges to higher education, with only 19% attaining a Bachelor’s degree, as do several SEAsian refugee populations such as Vietnamese, Hmong, Burmese, Cambodian, Lao & Bhutanese #DataEquity #AAPI #WhoWeAre
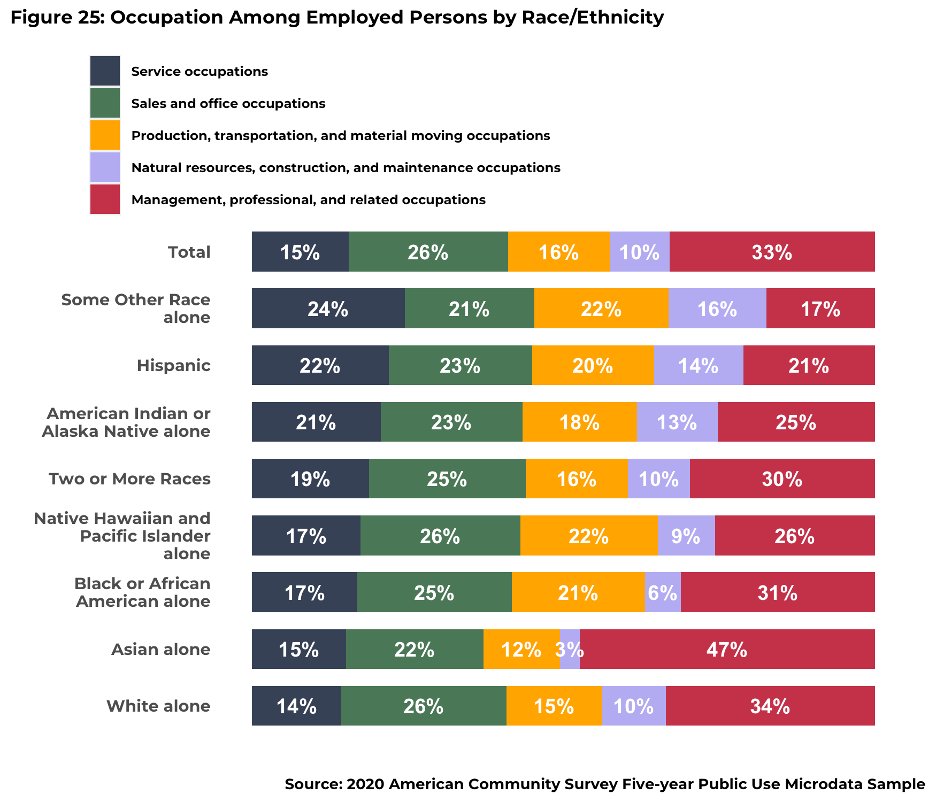
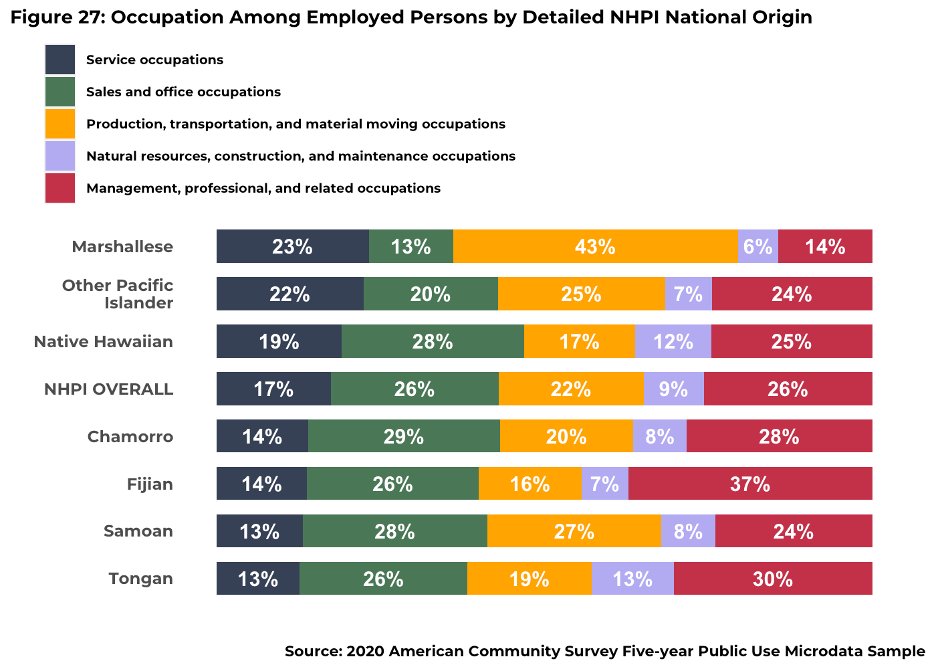
AA and NHPI groups have wide occupational variation. Refugee communities such as Bhutanese, Burmese, Cambodian, Laotian, Hmong, are overrepresented in production and logistics, and the same is true for Samoan Americans and Marshallese #DataEquity #AAPI #WhoWeAre
Poverty rates vary considerably by detailed origin, with Marshallese, Burmese, Mongolian, Malaysian, Bangladeshi, and Hmong Americans having levels of poverty much higher than the national average #DataEquity #AAPI #WhoWeAre
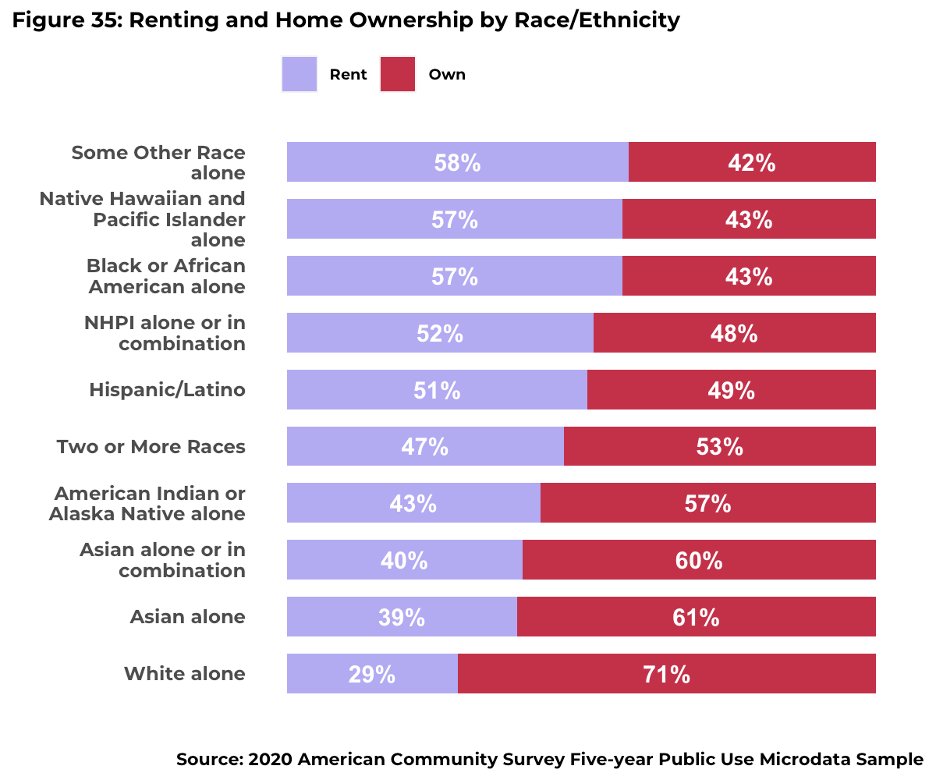
Homeownership among Asian Americans is much lower than non-Hispanic Whites. NHPI homeownership is among the lowest along with Black homeownership. Among detailed origin, Marshallese, Mongolians, Nepalese, and Bhutanese had the lowest among their peers #DataEquity #AAPI #WhoWeAre
Health insurance coverage among AAs and NHPIs varies. Mongolians were 3 times as likely to be without insurance compared to Asians overall. Marshallese and other Pacific Islanders were more likely to be without insurance compared with their NHPI peers #DataEquity #AAPI #WhoWeAre
On public opinion, AAs and NHPIs show strong support for a pathway to citizenship and for racial solidarity (as reflected in support for the Black Lives Matter movement), although there are variations on both of these issues by detailed origin #DataEquity #AAPI #WhoWeAre
Turnout for AA and NHPI voters has increased substantially during federal elections. AA voters are a fast growing segment of the U.S. electorate and are making some states more competitive in federal elections

• • •

Missing some Tweet in this thread? You can try to force a refresh
 

Keep Current with AAPI Data

AAPI Data Profile picture

Stay in touch and get notified when new unrolls are available from this author!

Read all threads

This Thread may be Removed Anytime!

PDF

Twitter may remove this content at anytime! Save it as PDF for later use!

Try unrolling a thread yourself!

how to unroll video
  1. Follow @ThreadReaderApp to mention us!

  2. From a Twitter thread mention us with a keyword "unroll"
@threadreaderapp unroll

Practice here first or read more on our help page!

More from @AAPIData

Jun 3
Achieving racial equity requires investments in good data. This report lays out 10 key recommendations for #AsianAmerican and #NHPI communities, building on the strong #DataEquity work of @WHOSTP @OMBPress @WHIAANHPI 🧵and link aapidata.com/wp-content/upl… 10 recommendations to advance data equity in AANHPI communit"Disaggregation Plus": Improved federal standards
First, we need federal investments in data collections on #AsianAmerican and #NHPI communities that can offer insights that can inform the work of various federal agencies #DataEquity #AAPI #WhoWeAre Recommendation #1: Create additional case studies and pilot
Next, we need to raise the federal minimum standard for data collection across all relevant agencies that expands upon the categories used in the 2020 Census and American Community Survey #DataEquity #AAPI #WhoWeAre Recommendation #2: Update the federal minimum standard for d
Read 11 tweets
Sep 15, 2020
Our webinar on findings from the new Asian American Voter Survey is starting NOW!

Join us: apia.vote/2020Survey
Compared to previous elections, many Asian Americans say they are more enthusiastic about voting this year.
Many Asian Americans say they have not been contacted about the 2020 election by Democrats, Republicans, or community organizations.
Read 12 tweets

Did Thread Reader help you today?

Support us! We are indie developers!


This site is made by just two indie developers on a laptop doing marketing, support and development! Read more about the story.

Become a Premium Member ($3/month or $30/year) and get exclusive features!

Become Premium

Don't want to be a Premium member but still want to support us?

Make a small donation by buying us coffee ($5) or help with server cost ($10)

Donate via Paypal

Or Donate anonymously using crypto!

Ethereum

0xfe58350B80634f60Fa6Dc149a72b4DFbc17D341E copy

Bitcoin

3ATGMxNzCUFzxpMCHL5sWSt4DVtS8UqXpi copy

Thank you for your support!

Follow Us on Twitter!

:(