1/ DAO governance activity is exploding 💥. In the last year, we have seen:
• 8.8x in # of DAOs
• 8.5x in # of proposals
• 8.3x in # of votes
🧵 Here are 10+ key insights from @SnapshotLabs data on DAO governance
• 8.8x in # of DAOs
• 8.5x in # of proposals
• 8.3x in # of votes
🧵 Here are 10+ key insights from @SnapshotLabs data on DAO governance

2/ DAOs have grown more than 8x in the past year, from 700 to 6000+ (excl. DAOs w/o proposals).
How long did it take to get here?
-0->1k: 1 year
-1k->2k: 3 months
-2k->4k: 2 months
-4k->6k: 6 months
Slowing but still impressive! What caused that spike on Nov '21 tho? Hint: 📜
How long did it take to get here?
-0->1k: 1 year
-1k->2k: 3 months
-2k->4k: 2 months
-4k->6k: 6 months
Slowing but still impressive! What caused that spike on Nov '21 tho? Hint: 📜
3/ @ConstitutionDAO was a pivotal moment for DAOs and the data shows it.
We have over 2x new proposals since then!
It also inspired new governooors, with similar DAOs forming like @LinksDAO & @KrauseHouseDAO. Would ❤️ some momentum for an EPL DA⚽️.
We have over 2x new proposals since then!
It also inspired new governooors, with similar DAOs forming like @LinksDAO & @KrauseHouseDAO. Would ❤️ some momentum for an EPL DA⚽️.
https://twitter.com/ConstitutionDAO/status/1461527514485035009
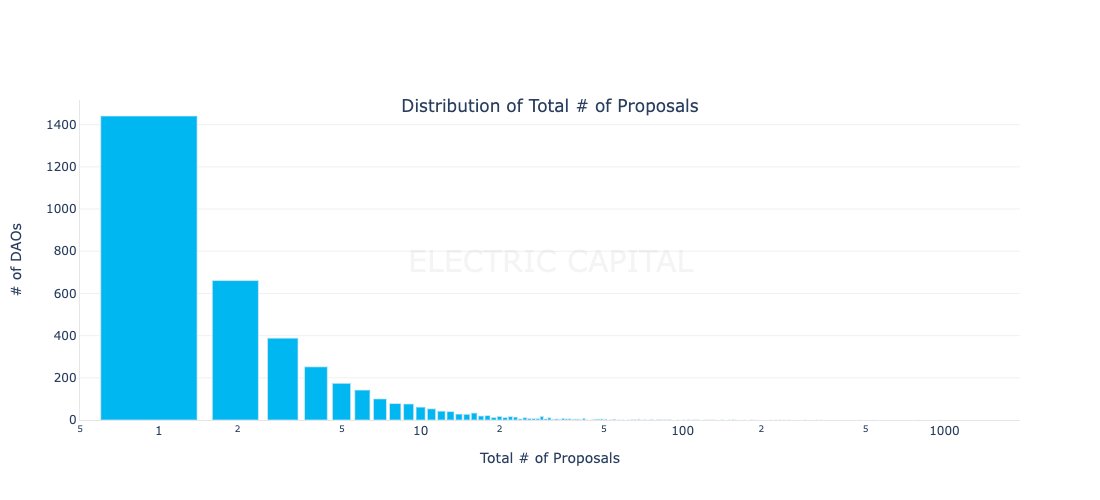
4/ This growth in proposal activity does come with a caveat; it's driven by a select few...
➡️ Over 65% of all proposals are from just 10% of DAOs.
A large % are still figuring things out, with 60% of them having voted on 3 proposals or less.
➡️ Over 65% of all proposals are from just 10% of DAOs.
A large % are still figuring things out, with 60% of them having voted on 3 proposals or less.
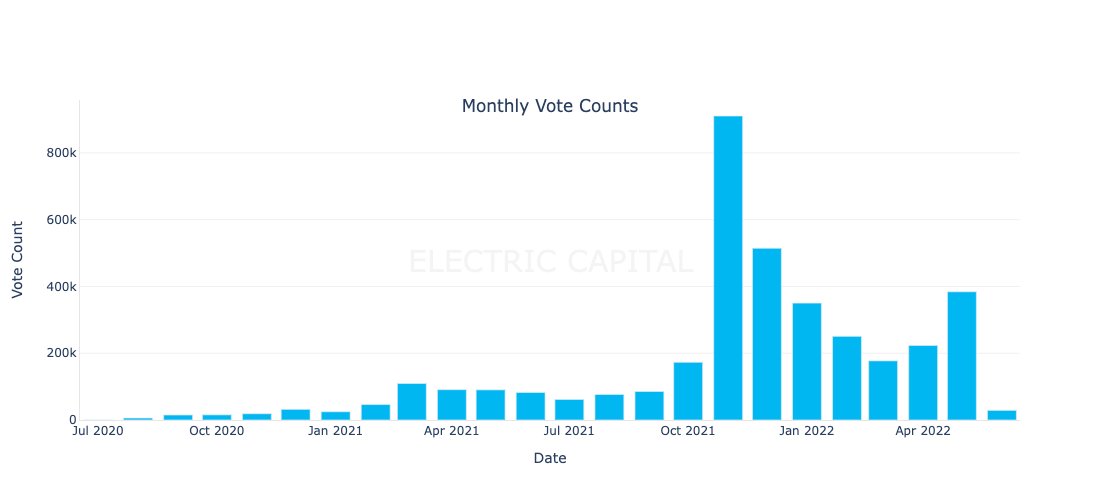
5/ Proposals are only one side of DAO governance. What does member participation look like (i.e. voting)?
That's up 8.3x! 🚀
- May 2021 -> May 2022: 448k -> 3.7M votes
Monthly votes are down from peak @ConstitutionDAO levels (Nov21), but still impressive growth.
That's up 8.3x! 🚀
- May 2021 -> May 2022: 448k -> 3.7M votes
Monthly votes are down from peak @ConstitutionDAO levels (Nov21), but still impressive growth.
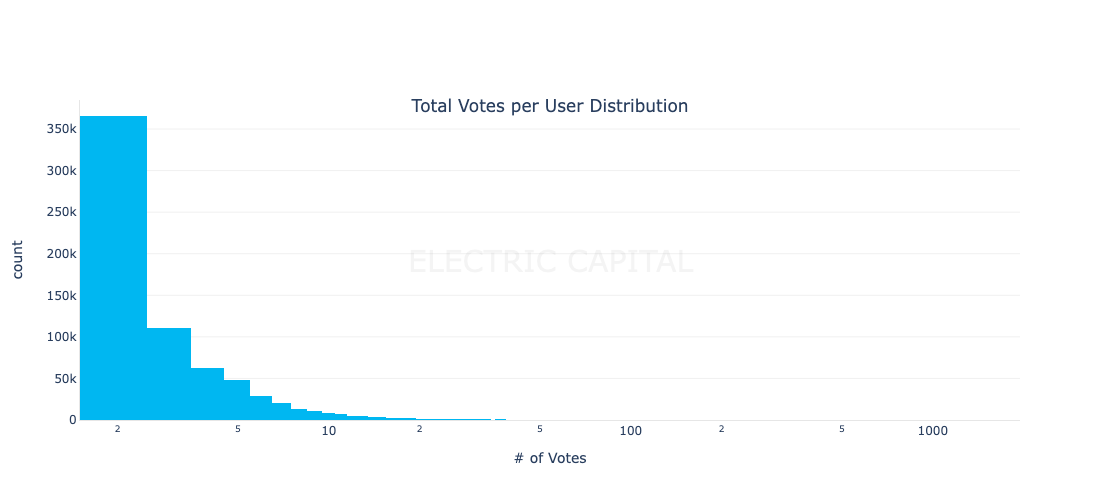
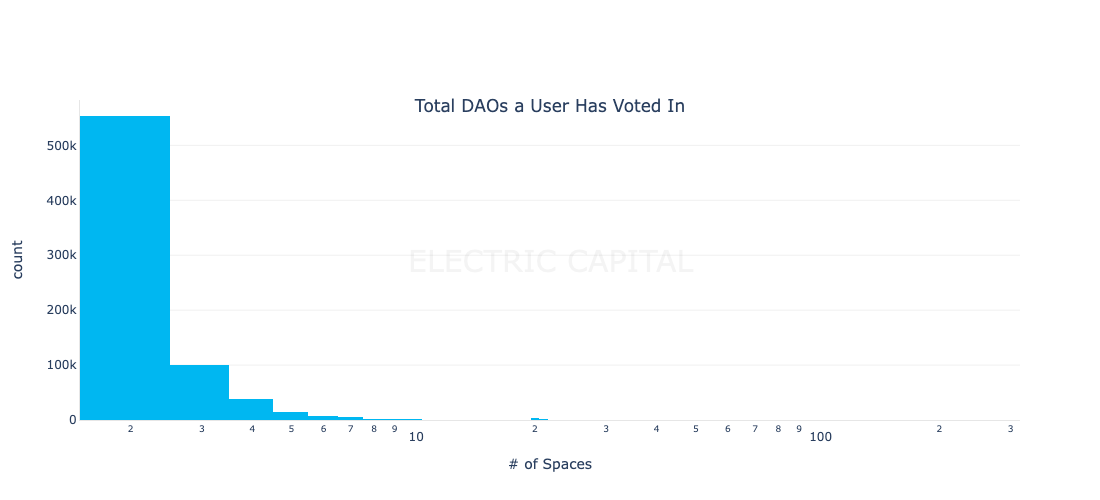
6/ What about individual voters, what does their activity look like in DAOs?
Unfortunately:
- 50% of users have voted just once
- 75% of users have voted for just 1 DAO
However, take this with a grain of salt. It's likely that many users vote with diff wallets for diff DAOs.
Unfortunately:
- 50% of users have voted just once
- 75% of users have voted for just 1 DAO
However, take this with a grain of salt. It's likely that many users vote with diff wallets for diff DAOs.
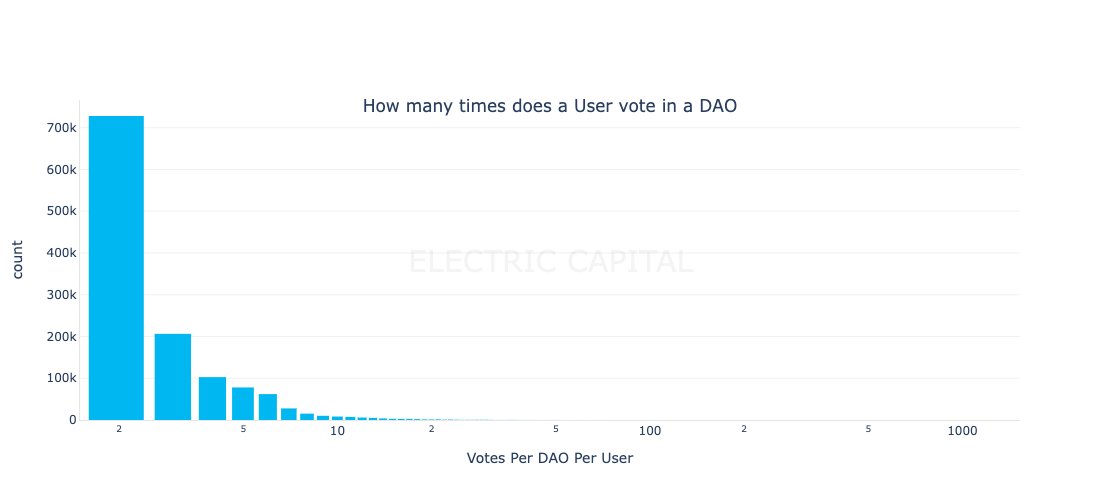
7/ A more reasonable approach is to analyze recurring votes by the same wallet for a DAO (i.e 1 wallet used per user per DAO).
Unfortunately, the results there are similar:
- 55% of wallets vote just once for a DAO
Finding loyal & active community members is hard!
Unfortunately, the results there are similar:
- 55% of wallets vote just once for a DAO
Finding loyal & active community members is hard!
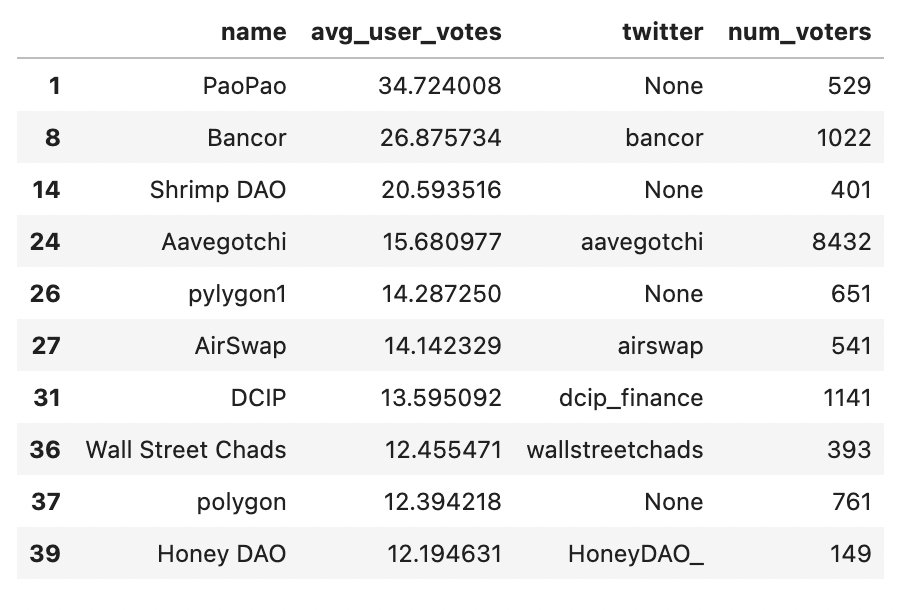
8/ Although most wallets vote just once per DAO, some DAOs have extremely loyal/fanatic voters.
- Certain DAOs average over 10 votes per member 🤯
shoutout to @bancor @aavegotchi @airswap @dcip_finance, @wallstreetchads @HoneyDAO_
- Certain DAOs average over 10 votes per member 🤯
shoutout to @bancor @aavegotchi @airswap @dcip_finance, @wallstreetchads @HoneyDAO_
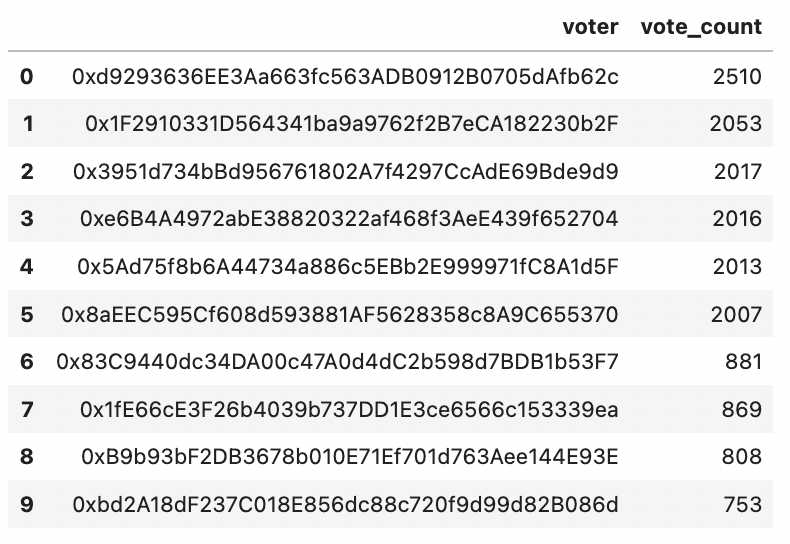
9/ One cool observation from voter analysis is the rise of a few early superstar 'governooors'. The top 5 users have 2000+ votes in a single DAO 😵
(if any of you rockstars read this, dm plz, would love to chat)
(if any of you rockstars read this, dm plz, would love to chat)
10/ On a different note, @optimismPBC recently removed a proposal by @cobie. Although there were no bad intentions and they re-listed it, it brings up the question:
- How decentralized is DAO governance? 🤔
What's the point if it's a C(entralized)AO?
- How decentralized is DAO governance? 🤔
What's the point if it's a C(entralized)AO?
11/ One way to measure how decentralized DAO governance is, is thru the Gini coef.
Gini is a measure of income equality but can also be applied to DAO voting, where:
1 = very centralized
0 = very decentralized
Gini is a measure of income equality but can also be applied to DAO voting, where:
1 = very centralized
0 = very decentralized
12/ For simplicity, let's only consider those that voted on an issue. I.e. Measure the skewness in power of actual votes per proposal. For example:
User: Voting Power
Alice: 1
Bob: 1
Carol: 10
Proposal Gini:
- If only A votes -> 1
- If A & B vote -> 0
User: Voting Power
Alice: 1
Bob: 1
Carol: 10
Proposal Gini:
- If only A votes -> 1
- If A & B vote -> 0
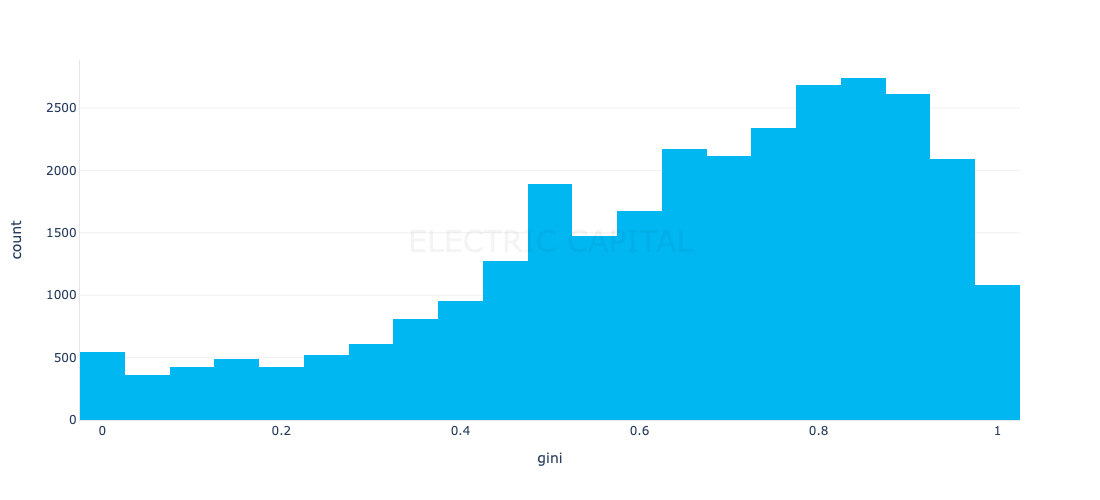
13/ Turns out, most DAO proposals are heavily skewed toward a few powerful voters.
Specifically;
➡️ ~25% of proposals are >= 0.8 Gini
That is, unfortunately, quite high 😬
Specifically;
➡️ ~25% of proposals are >= 0.8 Gini
That is, unfortunately, quite high 😬
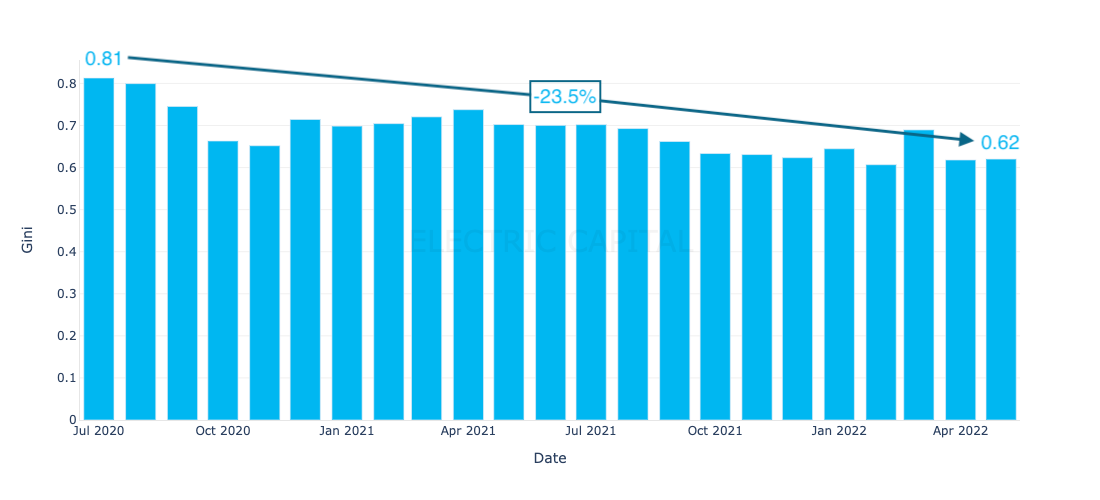
14/ There is hope though! DAO governance does seem to be going in the right direction and becoming more decentralized (albeit slowly).
➡️ A decrease of ~23% over the past year in avg Gini coeff (0.81->0.62)
➡️ A decrease of ~23% over the past year in avg Gini coeff (0.81->0.62)
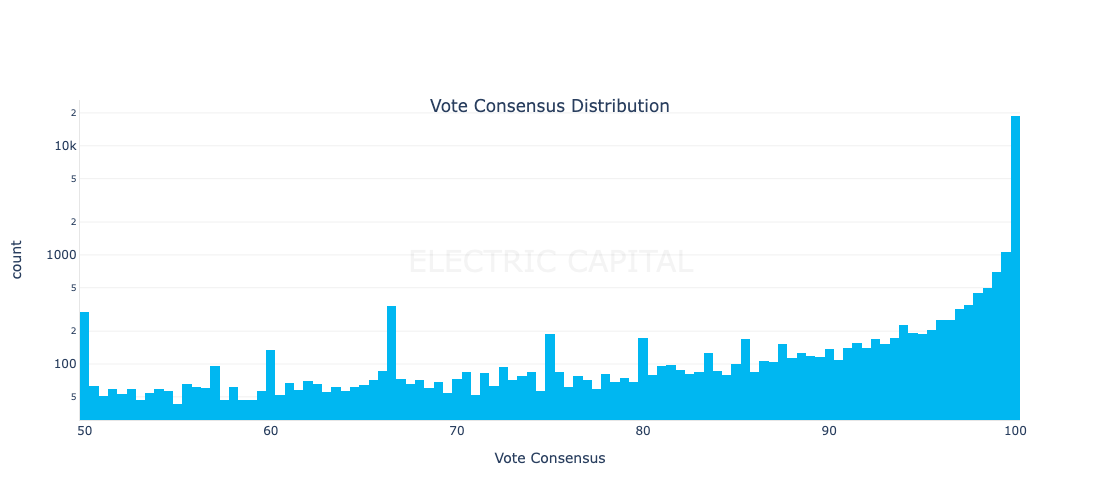
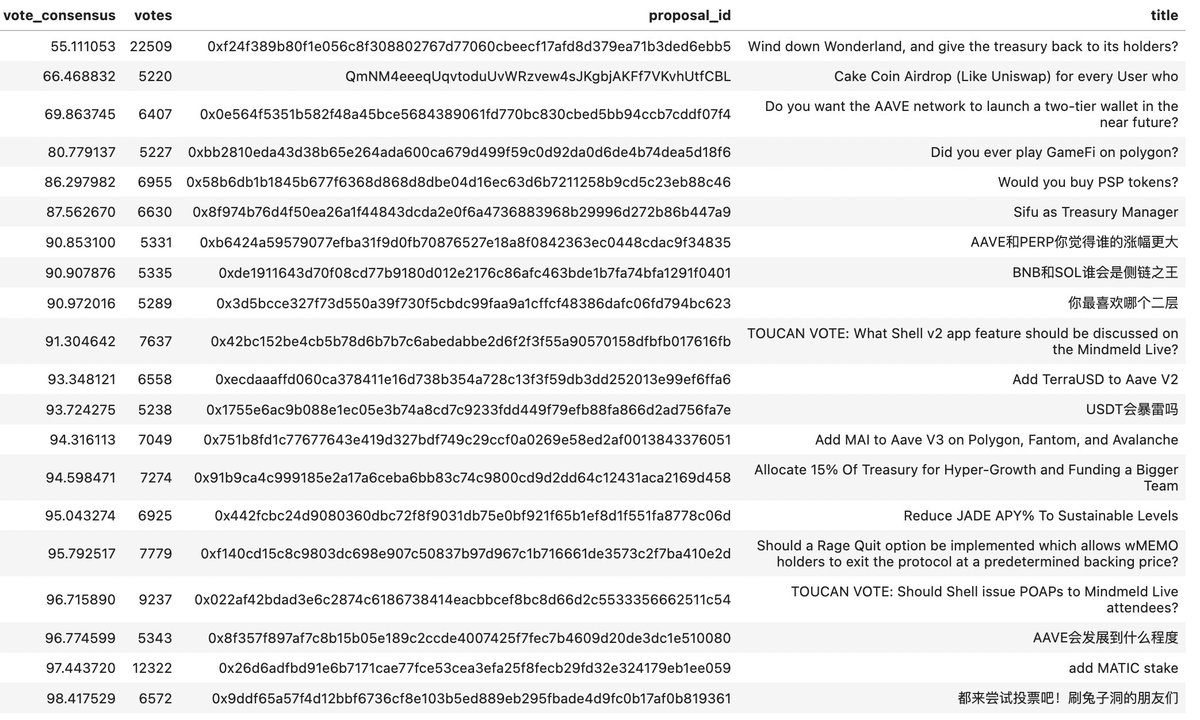
15/ What about proposal outcomes? Does everyone in a DAO just vote the same? Mostly, yes, but not always!
~1000 proposals won with less than 60% majority ⚖️
The highest-profile debate was for @Wonderland_fi. Of course, @0xSifu is in the mix too!
~1000 proposals won with less than 60% majority ⚖️
The highest-profile debate was for @Wonderland_fi. Of course, @0xSifu is in the mix too!
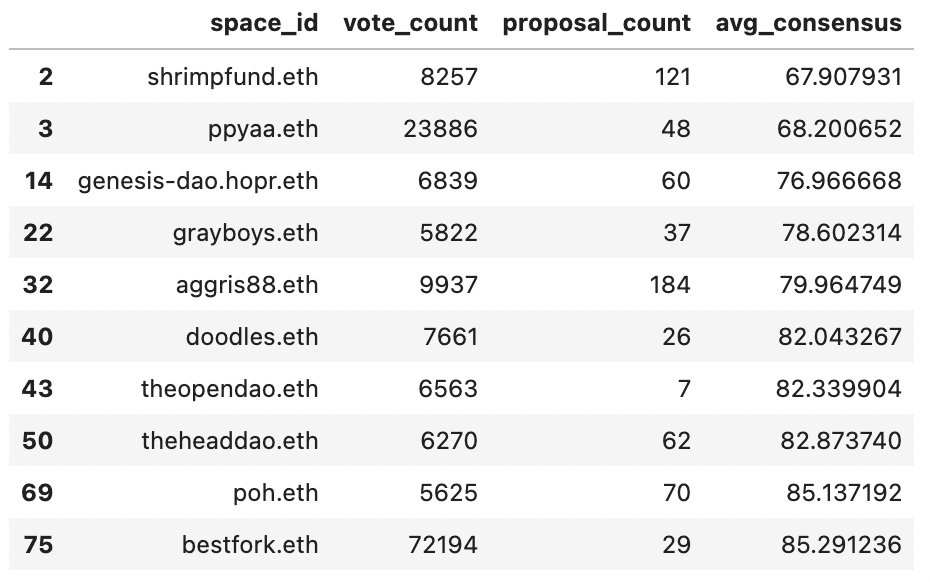
16/ I do think healthy debate is vital in any governance system🤝
With that, wanted to highlight some DAOs with a lot of it. Here are the top 10:
@Wonderland_fi @doodles @grayboysdao @proofofhumanity @The_OpenDAO
With that, wanted to highlight some DAOs with a lot of it. Here are the top 10:
@Wonderland_fi @doodles @grayboysdao @proofofhumanity @The_OpenDAO
17/ ...and that's a wrap! Recap:
➡️ # of DAOs w/ governance is growing (8x past year)
➡️ Large % proposals created by small % of DAOs
➡️ Voter activity up significantly over the past year
➡️ Recurring voters are hard to find
➡️ Voting power relatively centralized but improving
➡️ # of DAOs w/ governance is growing (8x past year)
➡️ Large % proposals created by small % of DAOs
➡️ Voter activity up significantly over the past year
➡️ Recurring voters are hard to find
➡️ Voting power relatively centralized but improving
18/ Huge thanks to @SnapshotLabs!
Also a big thank you to @eherrerosj, @mariashen, @mitchelljhammer, @puntium & @sanjaypshah for all your help and feedback.
Also a big thank you to @eherrerosj, @mariashen, @mitchelljhammer, @puntium & @sanjaypshah for all your help and feedback.
19/ Did you find this thread useful?
If so, help me out by:
→ giving me a follow at @n4motto for more data tweets on DAOs and all things Web3!
→ Going back up to the top and hitting that retweet button!
If so, help me out by:
→ giving me a follow at @n4motto for more data tweets on DAOs and all things Web3!
→ Going back up to the top and hitting that retweet button!
• • •
Missing some Tweet in this thread? You can try to
force a refresh