I am Grxxt Profile picture
Jun 11 3 tweets 2 min read
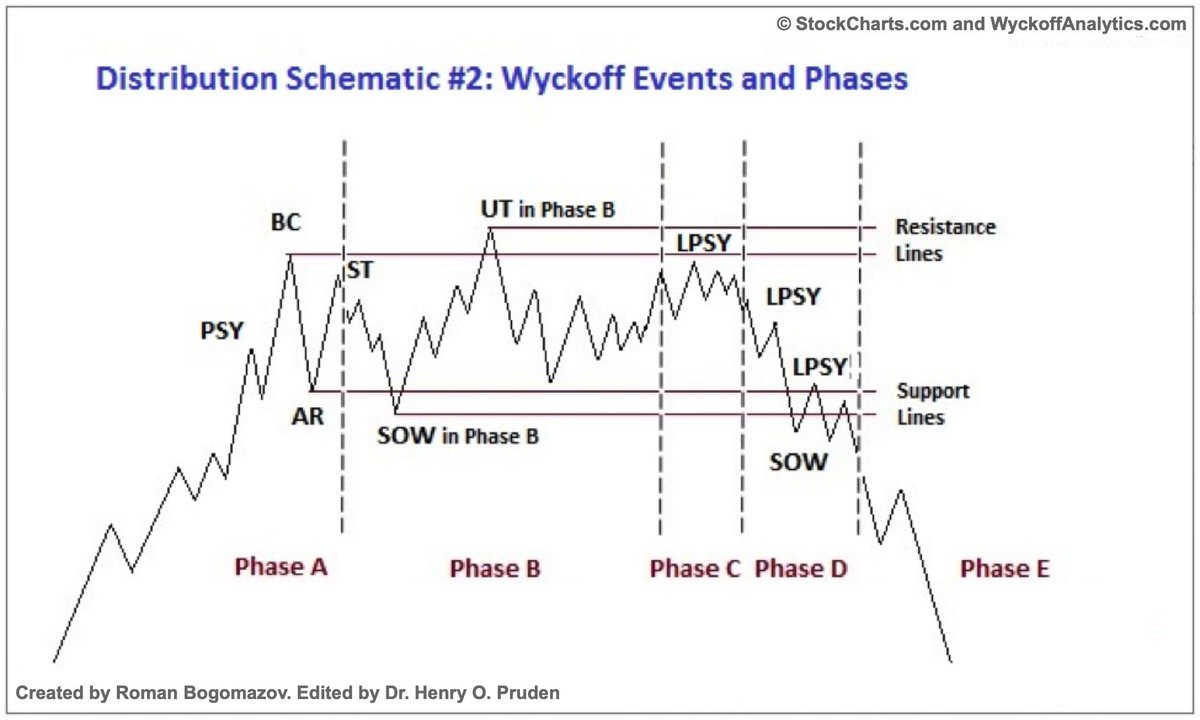
$BTC Wyckoff Distribution in detail. Just like $ETH, it looks like we are in the final phase before capitulation. I still don't think we will see the real bottom until September-February. See below 👇for why I think this. Stay safe out there everyone.🙏
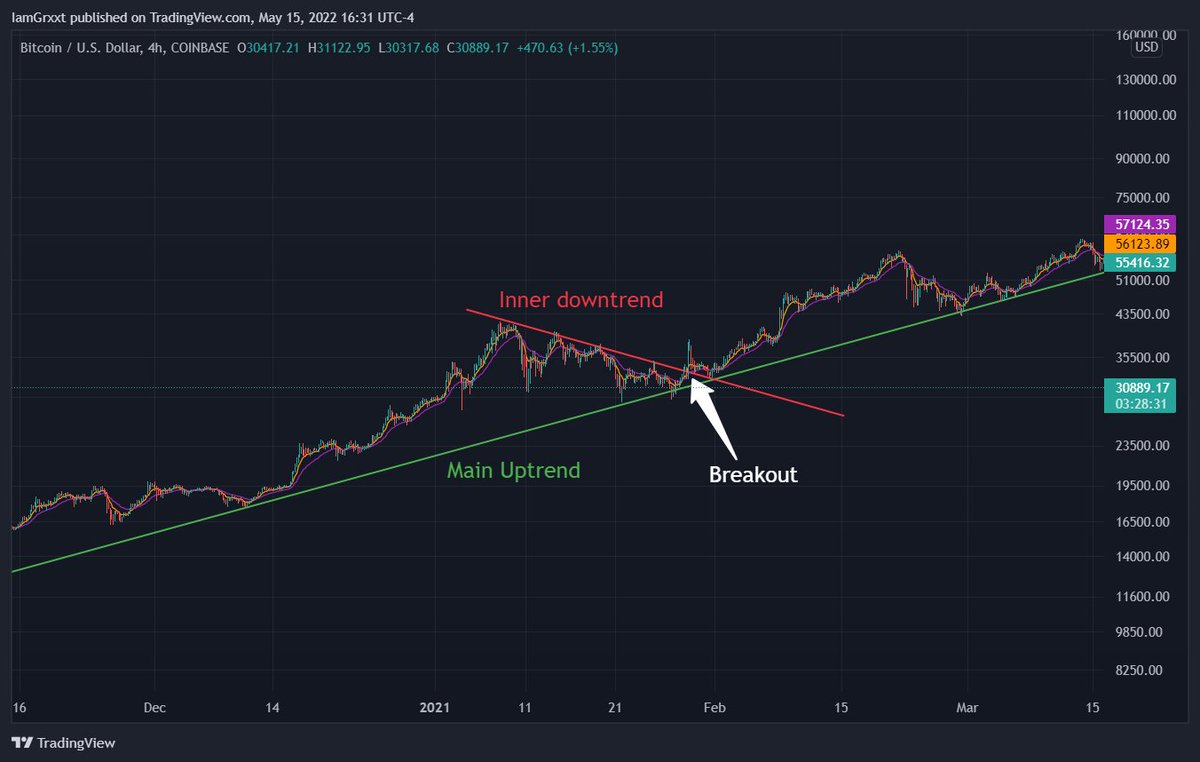
How I determined the bottom will most likely be between September 2022 and February of 2023.
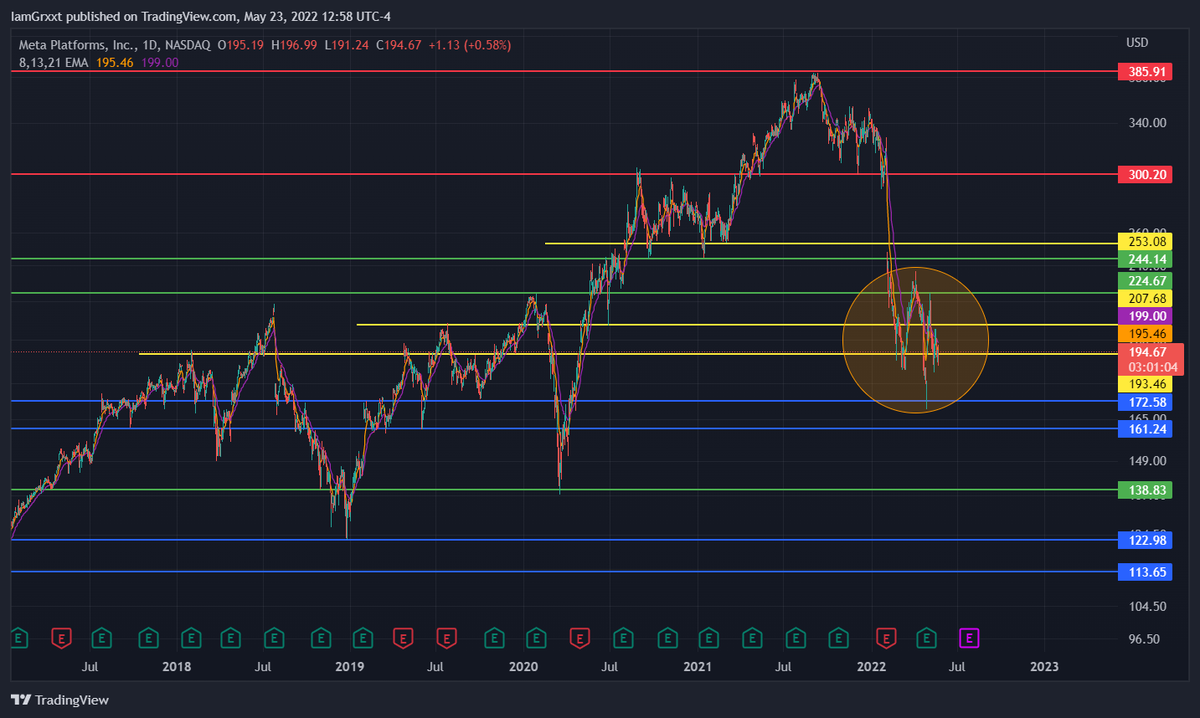
I've been warning about this for quite some time now. Technical analysis can save you tons of money. Doesn't matter if you're a #HODLer, long term investor, or a short term trader. Everyone can benefit from learning these things.

• • •

Missing some Tweet in this thread? You can try to force a refresh
 

Keep Current with I am Grxxt

I am Grxxt Profile picture

Stay in touch and get notified when new unrolls are available from this author!

Read all threads

This Thread may be Removed Anytime!

PDF

Twitter may remove this content at anytime! Save it as PDF for later use!

Try unrolling a thread yourself!

how to unroll video
  1. Follow @ThreadReaderApp to mention us!

  2. From a Twitter thread mention us with a keyword "unroll"
@threadreaderapp unroll

Practice here first or read more on our help page!

More from @IamGrxxt

Jun 9
$SPY We had a bullish 8/21 cross for a little while, but straight back down to bearish territory again today. With CPI data releasing at 8:30am EST tomorrow. The chart is telling us in advance what we can possibly expect.

Bearish MACD, RSI, 8/21, under Pivot. Not a good look. Image
$NQ in the same boat. I imagine crypto may suffer the same fate soon.

Let's take a look. Image
Under pivot, 8/21 bearish, rejected 0.5 above. There's literally NOTHING tech related I would buy right now. Image
Read 6 tweets
May 29
Here's a side-by-side of $SPX and $BTC since the March 2020 crash. Turns out it wasn't a crash, but just the dip before the rip! Now, what can we say? Well, mostly that people are taking profits after a massive increase taking advantage of retail traders like you and I.
🧵👇
I know a lot of people who are hurting. They just started investing for the first time recently. Most likely baited by the media, crypto Twitter price targets, or friends who showed them their huge gains. They just bought on word of mouth without doing any research.
What can we do now? Well there are two options:

1. Give up. You tried, it's too much and you don't feel like it's worth it to continue. Big money wins. You lose.

2. You can start learning, doing your own research, and make your own decisions based on technical analysis.
Read 8 tweets
May 28
Short term falling wedge. Potentially bullish set up with bullish divergence. $ETH
I've entered long on this with a stop just below the wedge. Let's see how it plays out. Short term price target is $1,940. Stop loss at $1,680. Entry is $1,730. I'm risking $50 to win $210. That's a 4:1+ R/R. Can this trade lose? Yes, but it's a calculated risk I'm taking.
So now that I've got the move I wanted, I'll move my stop to entry, go to sleep risk free, and hope we get the break out.
Read 13 tweets
May 23
Support and Resistance Explained:

I'll use Facebook(FB) stock for this example. Starting with a blank chart, on a high timeframe like the daily or weekly. I'm starting with the weekly because it offers more information to start. $FB
🧵👇
Look for the places where the price reacted more than once in the same location. The goal is to try and get as many candle touches on the line as possible. I like to mark areas of resistance in red(above current price), and support in blue(below current price).
Now zoom into a lower timeframe(daily) and adjust the lines to hit more candles. The green lines are previous lines I adjusted slightly, and the yellow lines are new ones I've found. Now that we have these, I'll zoom into a 4hr chart to see this circled area better.
Read 8 tweets
May 17
CANDLESTICK PATTERNS📈🕯️📉:

Today we are going to take a look at what the candles in a chart can tell us. There are many different candlestick patterns, and they can give clues to where the price could be going. Not all candlestick patterns work as well as others.
🧵👇
Increase in popularity has lowered their reliability because they've been studied by hedge funds and algorithms. These whales rely on super fast execution to trade against retail investors who execute technical analysis strategies found in books. Image
In other words, hedge fund managers use software to trap participants looking for high-odds bullish or bearish outcomes. However, reliable patterns continue to appear, allowing for short- and long-term profit opportunities.
Read 22 tweets
May 15
Technical Analysis 101

Steps:

1.Identifying the trend

There are main trends and then trends inside trends. Figuring out the direction is easy, but different time frames can give mixed results. Higher time frames are always more reliable, and where we find main trends.
🧵⬇️
2.Drawing support and resistance levels

Support and resistance levels are areas where the price is likely to reverse or set up for a breakout. A support level is where the price will find demand in a downtrend and turn upward. Vice-versa resistance will reject and turn downward.
3. Establishing entry and exit points

Using these levels, you can establish areas where you can to go long, or go short. If it breaks a resistance or support, you can enter on the break and use the level that broke as your stop loss. This maximizes your risk/reward ratio.
Read 7 tweets

Did Thread Reader help you today?

Support us! We are indie developers!


This site is made by just two indie developers on a laptop doing marketing, support and development! Read more about the story.

Become a Premium Member ($3/month or $30/year) and get exclusive features!

Become Premium

Don't want to be a Premium member but still want to support us?

Make a small donation by buying us coffee ($5) or help with server cost ($10)

Donate via Paypal

Or Donate anonymously using crypto!

Ethereum

0xfe58350B80634f60Fa6Dc149a72b4DFbc17D341E copy

Bitcoin

3ATGMxNzCUFzxpMCHL5sWSt4DVtS8UqXpi copy

Thank you for your support!

Follow Us on Twitter!

:(