As variants accumulate, it can be tricky to track combinations of past exposures (e.g. ), but to get some intuition, let's assume people simply get infected, build immunity, then gradually become susceptible to infection again (i.e. because variants). 2/ pubmed.ncbi.nlm.nih.gov/25800537/
If people become susceptible again rapidly, then we'll get new infections before the old ones have declined, and the level of infection will remain high. If it takes a while to become re-susceptible, then we'd expect gaps between epidemics and lower average infection levels. 3/
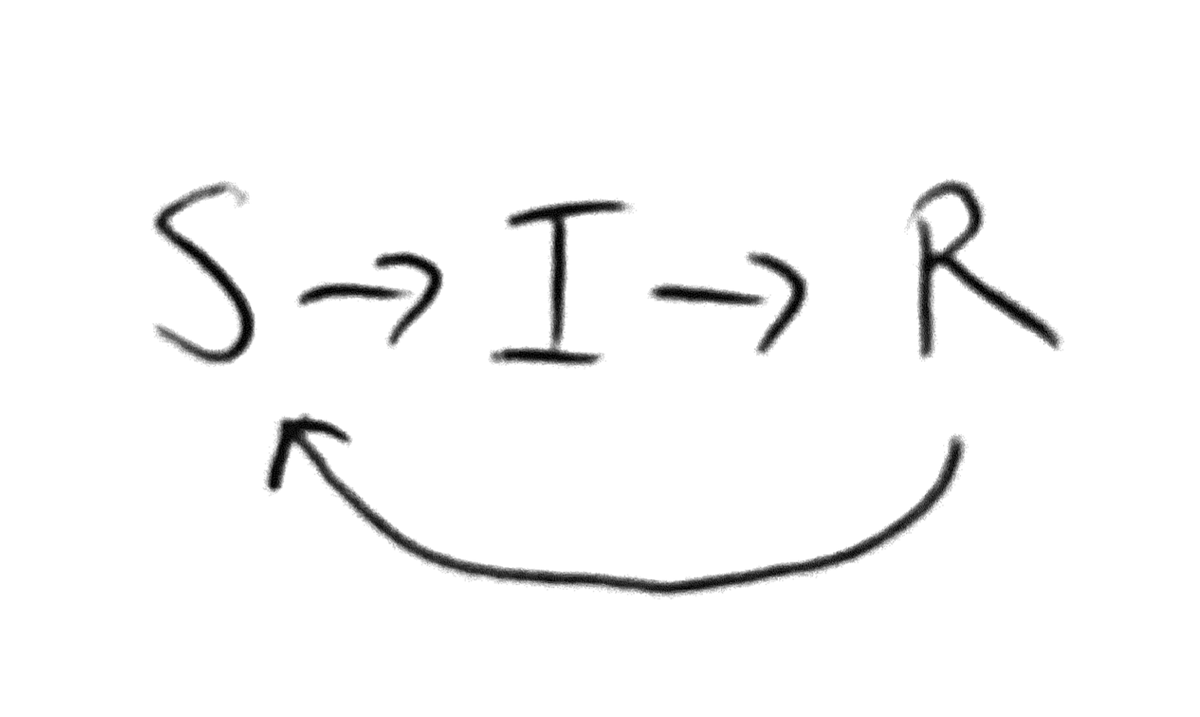
Using our (very) rough S ➡️ I ➡️ R ➡️ S process above, we can work out the level of infection (I*) corresponding to a given infectious period (d_inf) and duration of immunity (d_immunity). (Maths fans: this means solving for dI/dt = 0 if you fancy a puzzle.) 4/
It turns out this average level of infection is equal to: I* = (1-1/R0)/(1+d_immunity/d_inf), where R0 is the reproduction number if everyone were susceptible. If we assume people are infectious for about a week, we get the following picture: 5/
A couple of things jump out. First, once R0 is reasonably high, it's duration of immunity (i.e. rate of emergence of variants that evade immunity) that really drives average infection level, not the inherent transmissibility of those variants... 6/
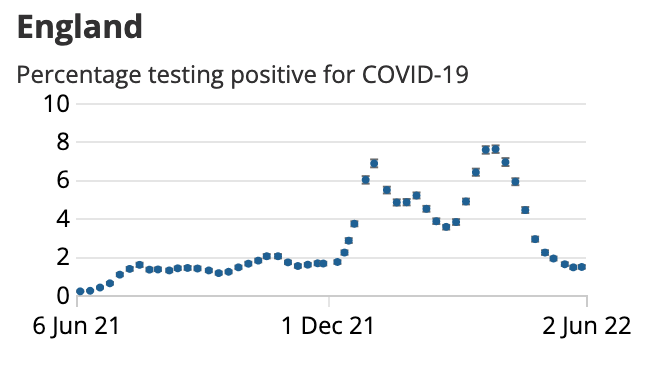
Second, we've seen infection % in ONS data in the 2-8% range during 2022, with two new variants dominating in past six months (BA.1, BA.2), and new ones now growing (BA.4 & BA.5). So roughly consistent with above plot if people become susceptible again every 3-4 months or so. 7/
Throughout pandemic, discussions have often had a 'one more wave, then it's all done' framing, but above illustrates infection could down to quite high average level, depending on rate of variant emergence and tools countries develop to counter them (e.g. new vaccines). 8/8
Technical note: The above assumes loss of immunity is gradual and exponentially distributed, whereas reality will depend on emergence of variants. However, can construct alternative models to explore short-term dynamics as well as average infection level: epubs.siam.org/doi/abs/10.113…
• • •
Missing some Tweet in this thread? You can try to
force a refresh
Good piece on the value of digital contact tracing in future pandemics by @marcelsalathe – combined with better linkage to venues of transmission (e.g. superspreading events), potential for a lot of impact here. 1/nature.com/articles/d4158…
During COVID, countries were competing with an exponential process, which meant any individual targeted intervention (like testing, isolation and contact tracing) had to be able to scale easily. Some places understood this more than others... 2/
There seemed to be a lot of media hostility to the idea of contact tracing apps at the time (e.g. below from Sep 2020), perhaps fueled mistrust of social media companies, Cambridge Analytica etc... 3/
It's remakable some people are still claiming COVID had a 'susceptible-infected-recovered-susceptible' dynamic early on, i.e. claiming most in UK got it in 1st wave and 2nd wave was driven by reinfections. Let's look at the heroic assumptions that this claim requires... 1/
1. Assumes first waves declined not because of reduction in contacts, but because of lots of infections and resulting strong immunising responses - and yet these widespread strong immune responses somehow weren't detectable on any antibody test. 2/
2. Assumes the similarity between transmission patterns estimated from social contact patterns in mid-2020 (like CoMix in UK) and transmission estimated from community infection data (e.g. REACT/ONS) is just a massive coincidence. 3/
I recently gave a talk at @JuniperConsort1 outlining some of the work we've been doing in @Epiverse_TRACE with @DataDotOrg and a range of collaborators to try and improve software tools for epidemic response - and how others can contribute to these collective efforts... 1/
As a motivation, I asked the question 'What could the final size of an epidemic be?' - as a first pass, there's a relatively simple method we could use based on an SIR model, but even implementing this can be complicated... 2/
As well as solving the above equation numerically, there are several steps we need to get to this point, from wrangling and cleaning data to estimate R0, to incorporating social contact data. 3/
Why it makes no sense to use total overall COVID deaths as the comparison metric when evaluating the impact of COVID measures, and why we need to focus on transmission dynamics instead. A thread… 1/
Suppose we have two countries, A and B. Country A adopts a lighter touch strategy X early on that gets the reproduction number down to 1 (i.e. epidemic remains flat). Country B leaves it later, then adopts a more stringent strategy Y to bring epidemic down (i.e. R below 1)… 2/
If we did a simple naive comparison of total deaths vs measures introduced, we’d conclude that strategy X (the lighter touch one) is linked with fewer deaths than the more stringent one…. 3/
In the past year, @LSHTM_CEPR has (co-)hosted events on a range of epidemic topics, from public trust and global treaties to analytics software and response strategies.
In case you missed them, here are few to catch up on…
Vernon Lee on Experience, evidence and some intuition in responding to COVID-19 in Singapore: lshtm.ac.uk/newsevents/eve…
Our inaugural research showcase, including Rosanna Peeling on diagnostics, Heidi Larson on vaccine confidence and Thom Banks on public health response: lshtm.ac.uk/newsevents/eve…
There's something a eerily familiar about todays' 'new' IEA report on lockdowns, right down to the text, tables, and half-baked methods. And, of course, the massive estimated effect of masks that somehow hasn't made it into the headlines... 1/
Lots has been written already about this issues with this analysis (e.g. above thread and factcheck.org/2022/03/sciche…), from a lack of accounting for epidemic dynamics to performing a 'meta-analysis' on datasets that aren't independent... 2/
It's a shame, because understanding impact of different NPIs is important - albeit difficult - question. Some studies have made sensible effort at untangling, finding that limiting gatherings and settings of gatherings probably had biggest impact (e.g. nature.com/articles/s4146…) 3/