It's time for another "It's all about the rent inflation" thread!
1/
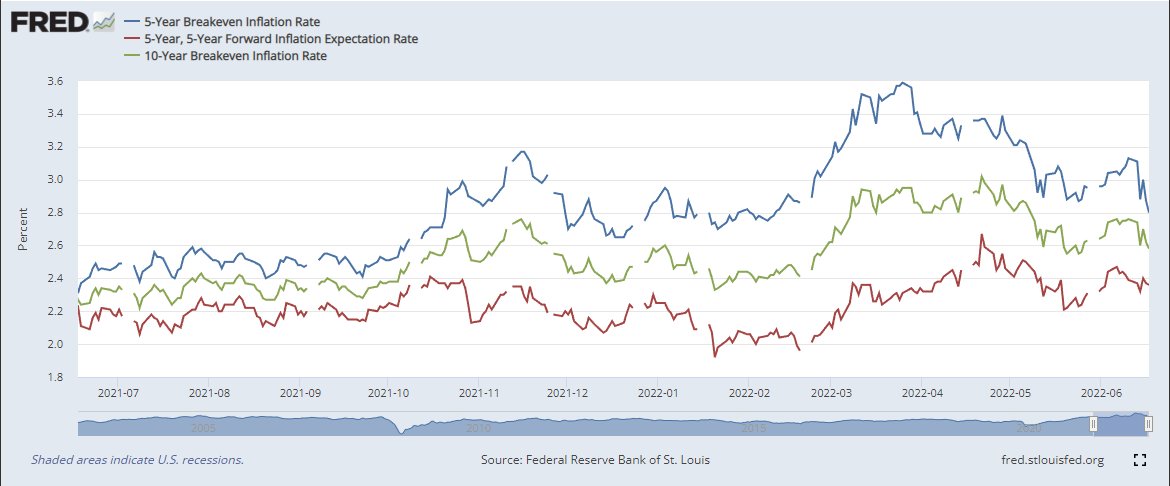
fred.stlouisfed.org/graph/?g=QLkO #FRED @stlouisfed
1/
fred.stlouisfed.org/graph/?g=QLkO #FRED @stlouisfed

For more than a decade now, real per capita housing expenditures are flat. And, you won't believe this crazy coincidence, but rent inflation just happened to go through the roof at the same time!
Wacky!
2/
Wacky!
2/
Keep in mind that with a decade of basement level mortgage rates, it is doubtful that buyers have been cutting back, so the story is probably worse for renters.
3/
3/
That difference doesn't show up in the aggregate data though, likely because there has been a compositional shift of formerly owned homes to rentals.
Here's an estimate of real expenditures/household for rental and owned. Both are basically flat since 2007.
4/
Here's an estimate of real expenditures/household for rental and owned. Both are basically flat since 2007.
4/

Today, I'd like to look at the recent mortgage rate spike. The average out-of-pocket cost for a new home is well above any recent comparisons, and it doesn't help much to use real numbers instead of nominal.
5/
5/

Back to rents, the marginal price for higher rents is much higher than the baseline cost.
You could think of US housing as shelter, with a steady price/rent ratio of about 13x and land, with p/r ranging from 15-40x depending on conditions (see thread).
6/
You could think of US housing as shelter, with a steady price/rent ratio of about 13x and land, with p/r ranging from 15-40x depending on conditions (see thread).
https://twitter.com/KAErdmann/status/1510385943038988291
6/
As you can see here, that appears to be the case cross-sectionally also.
So, when rents rise, price/rent ratios also rise. That appears to be the case over time, cross-sectionally within metros, and cross sectionally across metros.
Additional rent is land rent & it costs more.
7/
So, when rents rise, price/rent ratios also rise. That appears to be the case over time, cross-sectionally within metros, and cross sectionally across metros.
Additional rent is land rent & it costs more.
7/

So, let's look at the median price/rent from 2014 to 2022, cross-sectionally across metros (data from Zillow. All hail Zillow!).
8/
8/
Here, I show the average, the p/r in a metro with $1,250 median rent (in real 2022 $), p/r in a metro with $2,500 median rent, and the marginal increase in price for each $ increase in rent between metros (the regression line from above).
9/
9/

The price/rent in a baseline, stable real rent metro has steadily declined since 2014. The marginal $ for an extra $ of rent has steadily increased (to a level not uncommon during previous expansion times). So, the price to get into a metro with higher rents has increased...
10/
10/
And, the price to get into the average metro has also steadily increased, but that is purely because rents have risen in the average metro, so its price/rent reflects more land rents.
11/
11/
If we break out mortgage/rent ratios similarly, the mortgage/rent ratio in the benchmark metro had been gradually declining with low covid-era rates. The recent rate spike has basically brought price affordability back to 2014-2019 norms.
12/
12/

The rate spike has pushed mortgage payments higher in the expensive metros than they have been since at least 2014, and also in the average metro. But the reason the mortgage payment in average metros is so high is because the average metro is more of a high rent metro now.
13/
13/
What does this mean? It's just another way of me saying I don't think prices are particularly at risk of much of a drop.
The rents and prices in the most expensive metros are mainly moderated by the rate of outmigration - how quickly is it getting too painful to stay?
14/
The rents and prices in the most expensive metros are mainly moderated by the rate of outmigration - how quickly is it getting too painful to stay?
14/
Let's say that higher rates push the mortgage payments in the most expensive cities high enough to lower demand for housing. Unless it gets extreme, that will just reduce the number of outmigrants from a few hundred thousand families in the worst metros to something lower.
15/
15/
Inertia is working in favor of price stability. The first shoe to drop will simply be less displacement from the "superstar" cities.
IOW, the drop in demand in the most expensive cities that might be induced by higher mortgage rates has a natural countervailing force.
16/
IOW, the drop in demand in the most expensive cities that might be induced by higher mortgage rates has a natural countervailing force.
16/
At the other end of the spectrum, cities that haven't had unusual rent inflation don't have a mortgage affordability problem.
And, the only way to solve the rent problem at the heart of higher prices is to build, build, build.
17/17
Happy Fathers Day!
And, the only way to solve the rent problem at the heart of higher prices is to build, build, build.
17/17
Happy Fathers Day!
Ps. Just to be clear, I don’t know if there are any cities where the median mortgage/rent is no higher than it has been since 2014, but to the extent that it’s higher, it’s because rents in that city are higher!
• • •
Missing some Tweet in this thread? You can try to
force a refresh