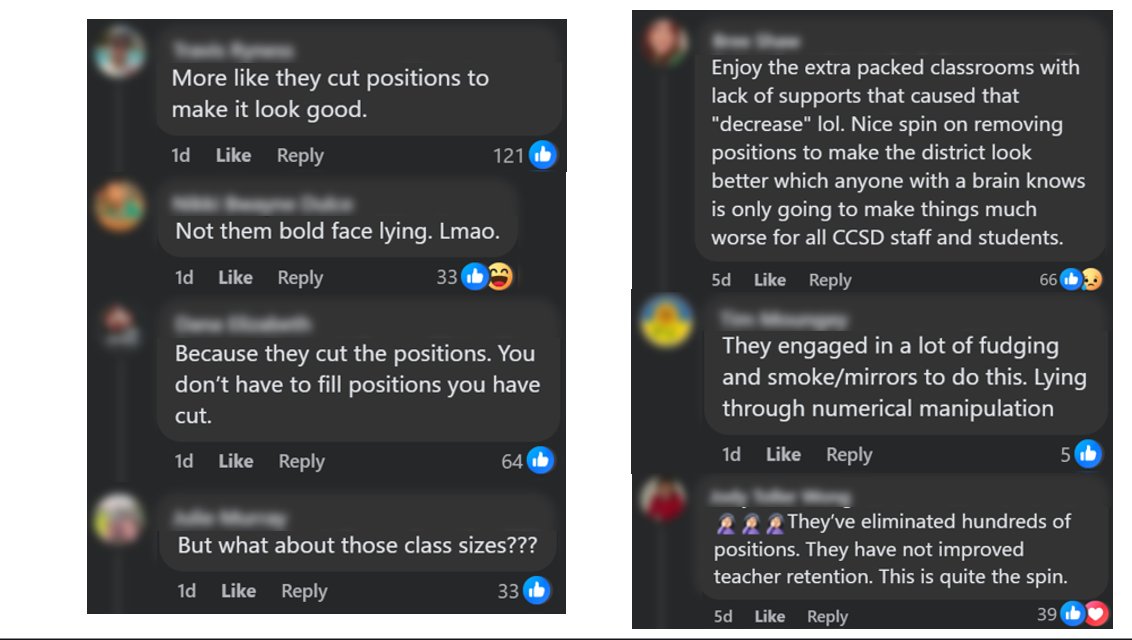
🚨 SCAM ALERT 🚨
On Thursday @ClarkCountySch will present an update on teacher vacancies to the Board.
The presentation is EXTREMELY misleading.
This thread explains how.
WARNING: This thread contains a lot of data, but you should still read the WHOLE thread.
#NVed #CCSD
1/?
On Thursday @ClarkCountySch will present an update on teacher vacancies to the Board.
The presentation is EXTREMELY misleading.
This thread explains how.
WARNING: This thread contains a lot of data, but you should still read the WHOLE thread.
#NVed #CCSD
1/?

2/?
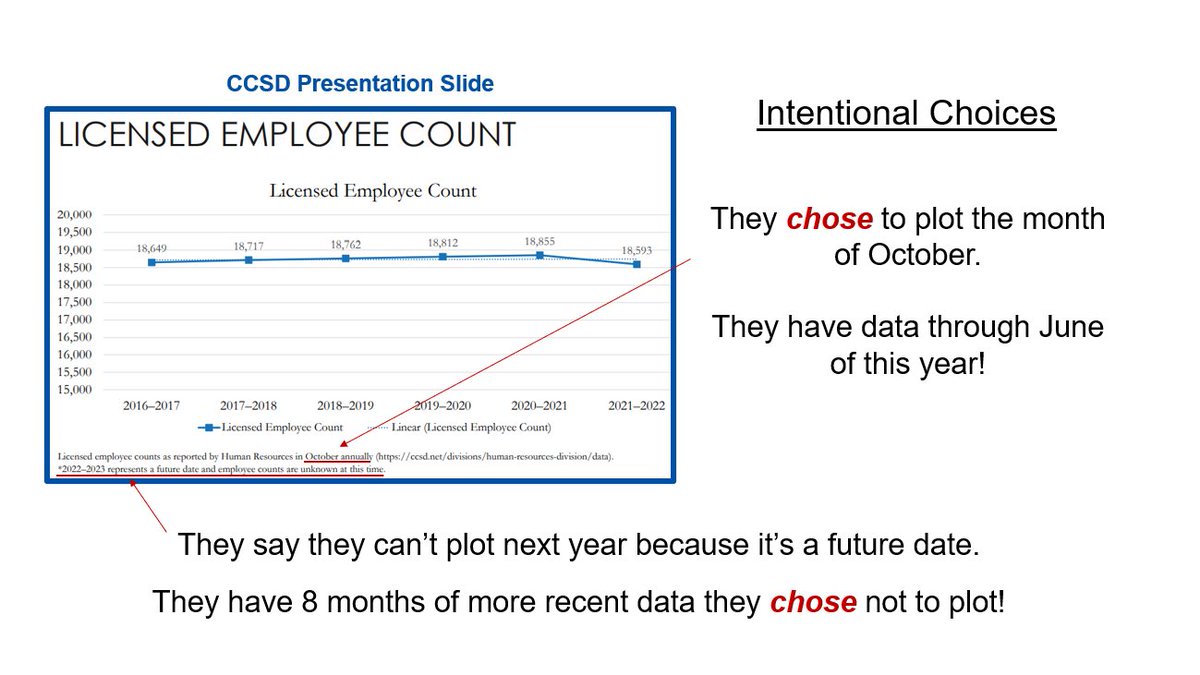
Here's the 1st chart on teacher/licensed staff counts in CCSD's presentation
Look at the chart & see if it conveys the BIGGEST headlines about CCSD's teacher workforce
#IntentionalChoices
Here's the 1st chart on teacher/licensed staff counts in CCSD's presentation
Look at the chart & see if it conveys the BIGGEST headlines about CCSD's teacher workforce
#IntentionalChoices

3/?
Hard to see here, but CCSD "analysts" added a flat dotted line to make it look like staffing hasn’t changed in 6 years.
They chose to add that line.
#IntentionalChoices
Hard to see here, but CCSD "analysts" added a flat dotted line to make it look like staffing hasn’t changed in 6 years.
They chose to add that line.
#IntentionalChoices

4/?
CCSD “analysts” chose to plot data for the month of October.
They have data for the next 8 months they are not showing.
Next, we'll chart more data points for a clearer picture.
#IntentionalChoices
CCSD “analysts” chose to plot data for the month of October.
They have data for the next 8 months they are not showing.
Next, we'll chart more data points for a clearer picture.
#IntentionalChoices
5/?
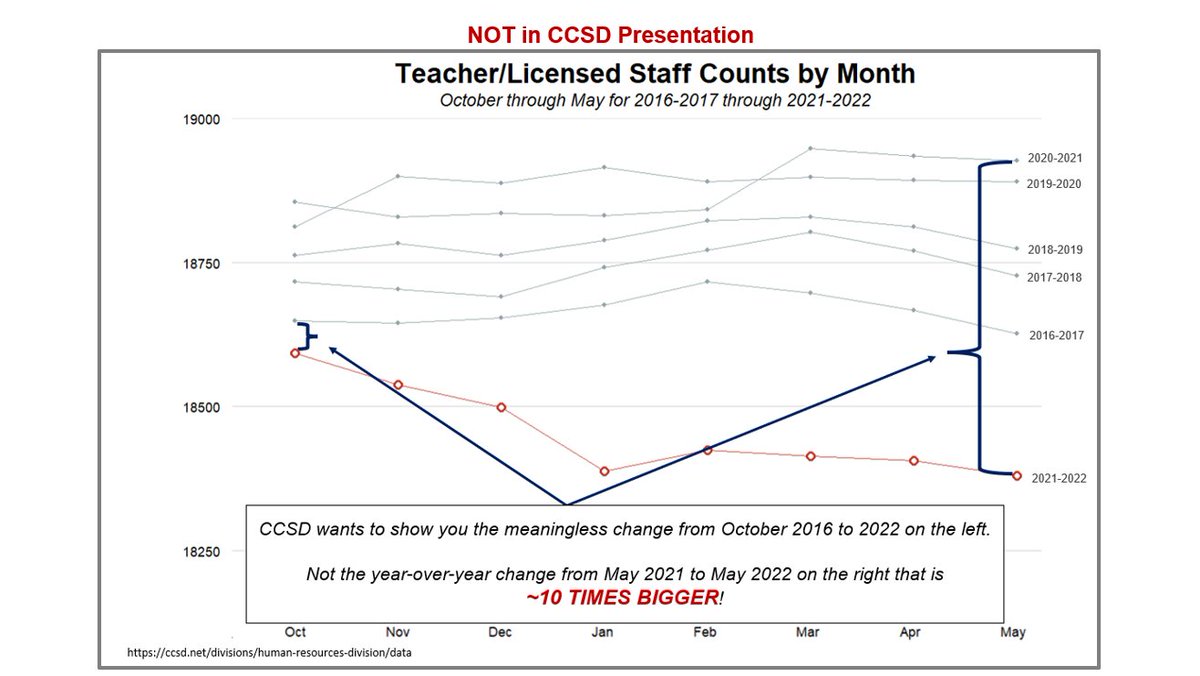
We’re using the same data reports as CCSD.
We’re showing all months Oct-May for each school year.
Can you see how different this year is?
Could you see it in CCSD’s chart?
We’re using the same data reports as CCSD.
We’re showing all months Oct-May for each school year.
Can you see how different this year is?
Could you see it in CCSD’s chart?

6/?
CCSD wants you to focus on the small change between Oct 2016 and 2022 on the left.
They don’t want you looking at the massive and relevant year-over-year drop that’s ~10 TIMES BIGGER on the right!
#IntentionalChoices
CCSD wants you to focus on the small change between Oct 2016 and 2022 on the left.
They don’t want you looking at the massive and relevant year-over-year drop that’s ~10 TIMES BIGGER on the right!
#IntentionalChoices
7/?
Seriously!
That small drop is what they INTENTIONALLY CHOSE to highlight in their report.
Not the relevant drop that is ~10x’s bigger year over year.
P.S.
It’s even bigger if we look at June
(we didn’t because it’s outside the school year)
Seriously!
That small drop is what they INTENTIONALLY CHOSE to highlight in their report.
Not the relevant drop that is ~10x’s bigger year over year.
P.S.
It’s even bigger if we look at June
(we didn’t because it’s outside the school year)

8/?
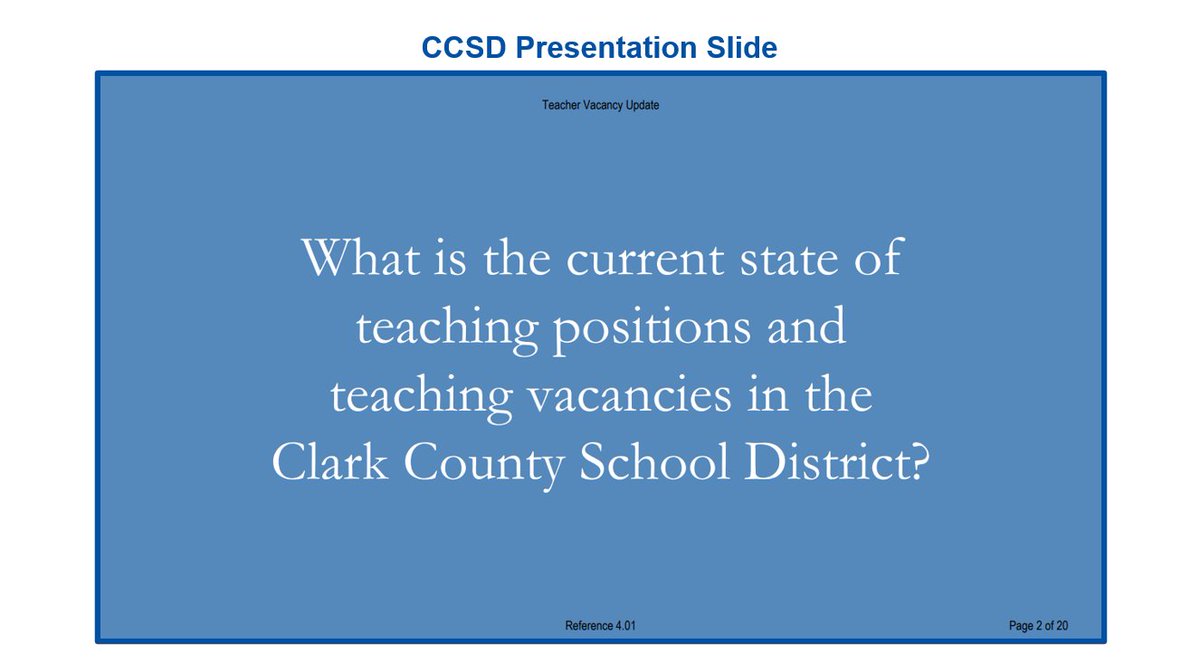
How can you have a presentation about the current state of teaching positions WITHOUT talking about the ongoing record exodus of your teachers???
Since they refuse to tell you about it, we will...
#IntentionalChoices
How can you have a presentation about the current state of teaching positions WITHOUT talking about the ongoing record exodus of your teachers???
Since they refuse to tell you about it, we will...
#IntentionalChoices
9/?
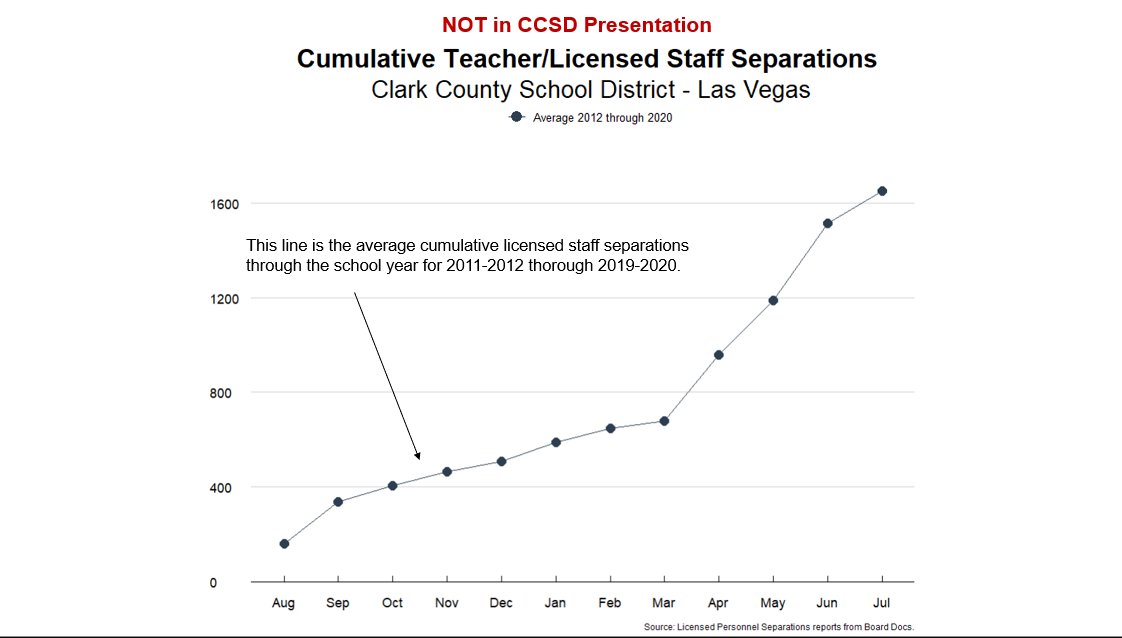
Every Board Meeting CCSD posts a list of teachers/licensed staff leaving CCSD
This chart shows the avg cumulative separations by month from 2011-12 through 2019-20
It's showing how the staff from those reports add up through the school year until it hits the total in July.
Every Board Meeting CCSD posts a list of teachers/licensed staff leaving CCSD
This chart shows the avg cumulative separations by month from 2011-12 through 2019-20
It's showing how the staff from those reports add up through the school year until it hits the total in July.
10/?
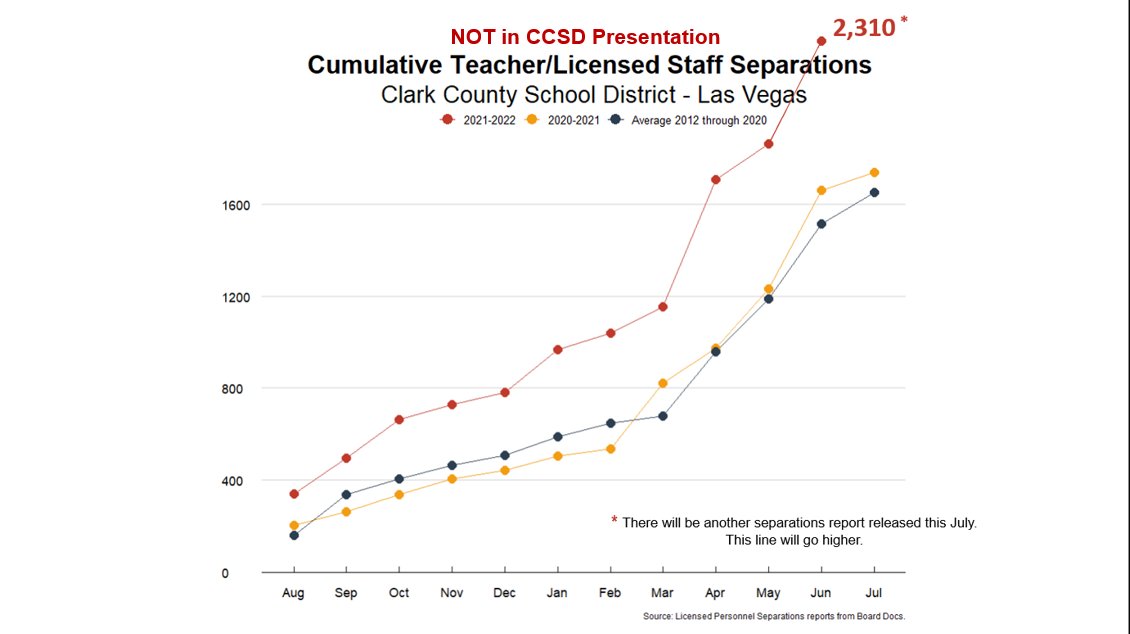
Last year CCSD saw the fewest teacher separations through February of any school year in the last decade.
After the vaccine came out, separations accelerated and ended the year above average.
Next, let’s see what it looks like this year…
Last year CCSD saw the fewest teacher separations through February of any school year in the last decade.
After the vaccine came out, separations accelerated and ended the year above average.
Next, let’s see what it looks like this year…

11/?
This is just through June.
There will be another report in July.
This will go HIGHER. #OffTheCharts
CCSD chose not to share any of this in the vacancy update
#IntentionalChoices #NVed
This is just through June.
There will be another report in July.
This will go HIGHER. #OffTheCharts
CCSD chose not to share any of this in the vacancy update
#IntentionalChoices #NVed
12/?
For transparency’s sake, this chart displays the teacher/licensed separations for every school year since 2011-12.
Do you see why we’ve been sounding the alarm ALL YEAR?
They are intentionally choosing not to talk about this.
#IntentionalChoices #CCSD
For transparency’s sake, this chart displays the teacher/licensed separations for every school year since 2011-12.
Do you see why we’ve been sounding the alarm ALL YEAR?
They are intentionally choosing not to talk about this.
#IntentionalChoices #CCSD

13/?
How can you have a presentation about the current state of teaching vacancies WITHOUT talking about WHY teachers are leaving???
Since they refuse to tell you about it, we will...
#IntentionalChoices
How can you have a presentation about the current state of teaching vacancies WITHOUT talking about WHY teachers are leaving???
Since they refuse to tell you about it, we will...
#IntentionalChoices

14/?
5 TIMES MORE teachers left CCSD because they were “Dissatisfied with the District” than in a typical year
MORE than the next 3 HIGHEST YEARS COMBINED!
But you can’t tell that from CCSD's chart they made to look like staffing hasn’t changed in 6 yrs
#IntentionalChoices
5 TIMES MORE teachers left CCSD because they were “Dissatisfied with the District” than in a typical year
MORE than the next 3 HIGHEST YEARS COMBINED!
But you can’t tell that from CCSD's chart they made to look like staffing hasn’t changed in 6 yrs
#IntentionalChoices

15/?
We’ve just shown that CCSD is experiencing the BIGGEST teacher exodus they have EVER experienced.
Teachers are more frustrated with the district than they have EVER been.
Despite this, let’s see what CCSD’s findings were…
#IntentionalChoices
We’ve just shown that CCSD is experiencing the BIGGEST teacher exodus they have EVER experienced.
Teachers are more frustrated with the district than they have EVER been.
Despite this, let’s see what CCSD’s findings were…
#IntentionalChoices

16/?
CCSD’s “Initial Findings” did NOT find the record exodus of their teachers #IntentionalChoices
Instead, there aren’t enough people to hire
&
Schools hire non-classroom staff
CCSD leadership CHOOSES to blame principals rather than acknowledge their own colossal failure
CCSD’s “Initial Findings” did NOT find the record exodus of their teachers #IntentionalChoices
Instead, there aren’t enough people to hire
&
Schools hire non-classroom staff
CCSD leadership CHOOSES to blame principals rather than acknowledge their own colossal failure

17/?
CCSD is aware of the claim they're admin top heavy
Here they divert your attention to believe it’s all in the schools
Diverting blame to principals is a hallmark of CCSD leadership
Once again, they are NOT showing you the most current data
#IntentionalChoices
CCSD is aware of the claim they're admin top heavy
Here they divert your attention to believe it’s all in the schools
Diverting blame to principals is a hallmark of CCSD leadership
Once again, they are NOT showing you the most current data
#IntentionalChoices

18/?
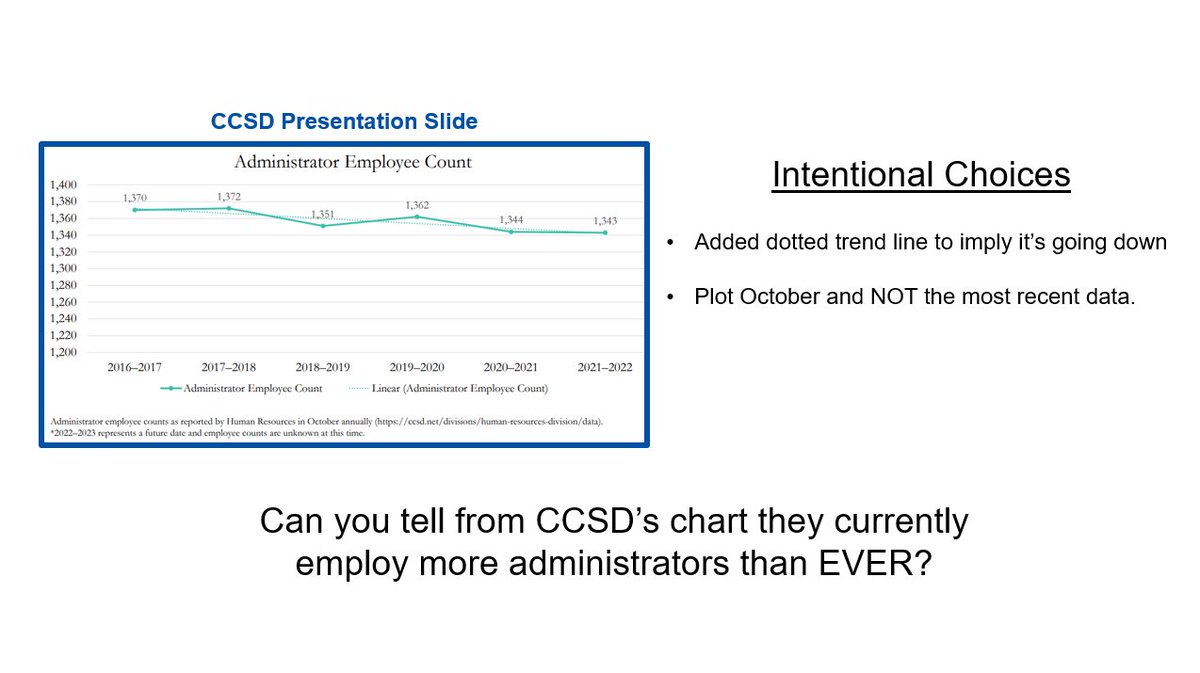
Can you tell from this chart that CCSD employs more administrators than EVER?
Of course not.
That’s NOT the story they want to tell you.
#IntentionalChoices
Can you tell from this chart that CCSD employs more administrators than EVER?
Of course not.
That’s NOT the story they want to tell you.
#IntentionalChoices
19/?
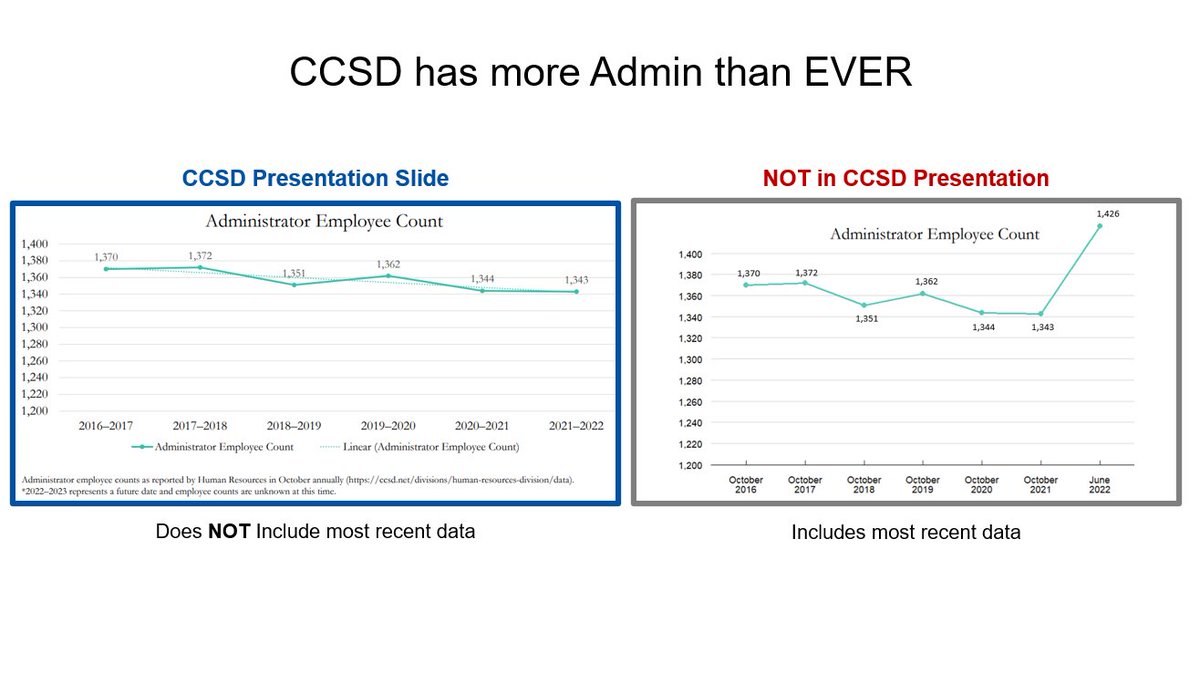
If they added the current data (chart on the right), it would mess up their trendline story.
CCSD can’t have pesky facts getting in the way of a good story.
#IntentionalChoices
If they added the current data (chart on the right), it would mess up their trendline story.
CCSD can’t have pesky facts getting in the way of a good story.
#IntentionalChoices
20/?
Not only does CCSD have more admin than ever, but they’re also paying District leadership more than EVER.
Jara’s Chief HR pick (a fellow Florida alum) inked a deal for $50k MORE than the prior Chief HR salary
Is Jara using our tax $ to pay for talent or obedience?
Not only does CCSD have more admin than ever, but they’re also paying District leadership more than EVER.
Jara’s Chief HR pick (a fellow Florida alum) inked a deal for $50k MORE than the prior Chief HR salary
Is Jara using our tax $ to pay for talent or obedience?

21/?
This is their BEST foot forward:
Vacancies aren't really a problem because students are leaving faster than our teachers can find another job 🤯
This is their BEST foot forward:
Vacancies aren't really a problem because students are leaving faster than our teachers can find another job 🤯
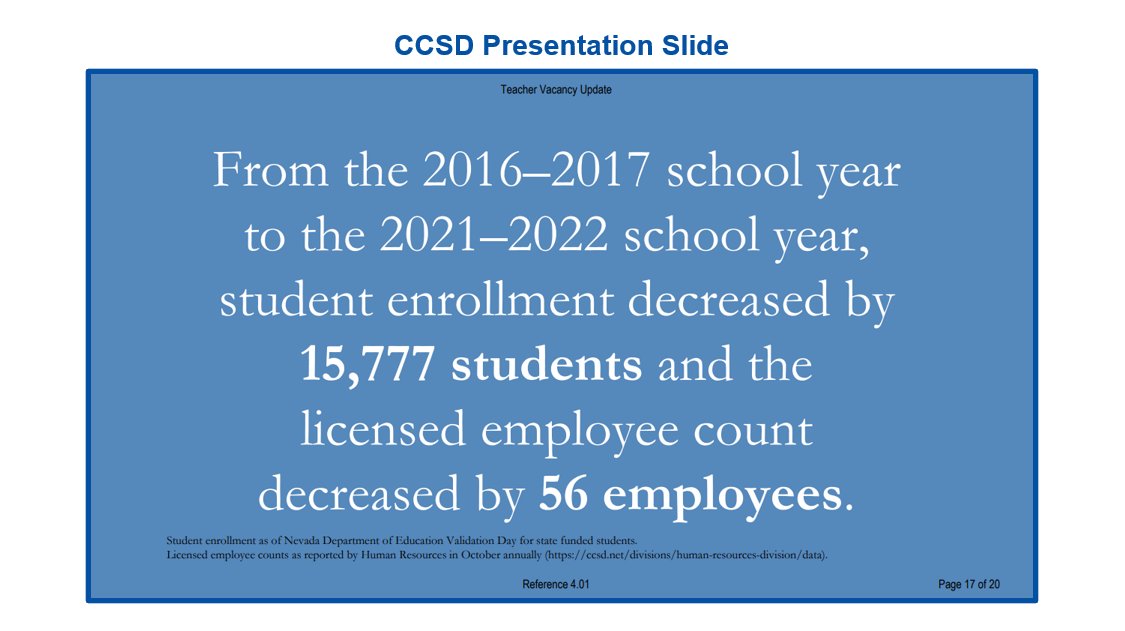
22/?
Imagine the conversation below happening between a Board of Directors & their CEO
Do you see how stupid this is?
Would you invest in this company?
Would you give the CEO a raise & $1.5 million?
Would you even continue to employ this CEO?
Imagine the conversation below happening between a Board of Directors & their CEO
Do you see how stupid this is?
Would you invest in this company?
Would you give the CEO a raise & $1.5 million?
Would you even continue to employ this CEO?

23/?
Taxpayers gave CCSD more $ than ever
CCSD created more positions
But more people keep quitting
The massive drop in enrollment is NOT the reason for the drop in teachers
BOTH are caused by anger w/ District leadership!
Taxpayers gave CCSD more $ than ever
CCSD created more positions
But more people keep quitting
The massive drop in enrollment is NOT the reason for the drop in teachers
BOTH are caused by anger w/ District leadership!

24/?
It’s time for tough questions!
CCSD’s presentation on teacher vacancies is misleading
It is presented to the Board of Trustees
@CCSD_Trustees, are you being misled OR
Are you misleading the public?
#NowItsYourChoice
It’s time for tough questions!
CCSD’s presentation on teacher vacancies is misleading
It is presented to the Board of Trustees
@CCSD_Trustees, are you being misled OR
Are you misleading the public?
#NowItsYourChoice

25/25
The longer people allow this to go on and don’t open their eyes to what’s really happening,
the longer the children of our community continue to suffer.
#DontBeFooled
The longer people allow this to go on and don’t open their eyes to what’s really happening,
the longer the children of our community continue to suffer.
#DontBeFooled

• • •
Missing some Tweet in this thread? You can try to
force a refresh


