Tony Profile picture
Jun 25, 2022 14 tweets 5 min read Read on X
The following thread will be on Liquidity Grabs, what they are, and how to avoid falling victim to them: ⬇️
Liquidity Grabs are performed by MM's or Market Makers to execute trades at the best possible price, to complete a partially filled order without sacrificing a less than favorable fill, or inflating the price of XYZ stock while trying to get filled.
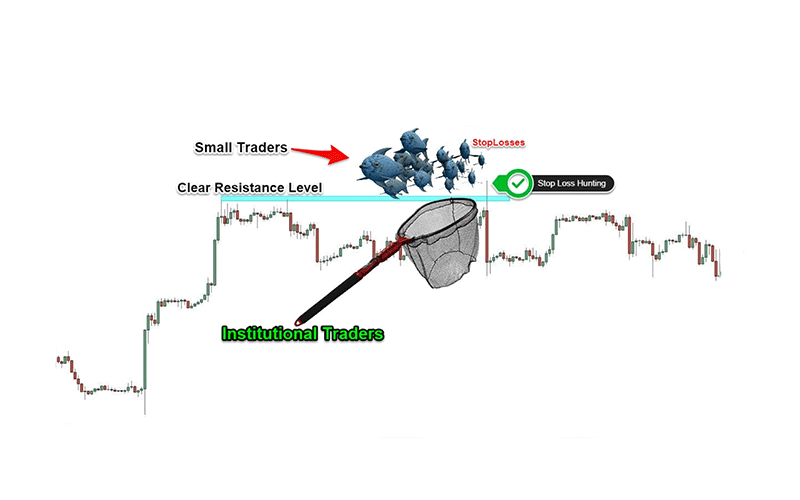
Another term for this that you are probably familiar with is Stop Loss Hunting. MM's will move the price of XYZ in whichever direction they want, trying to create liquidity from triggering stop losses placed by retail traders.
By triggering these "Liquidity Pool" areas, they are not only getting their orders filled, but at a cheaper and better price than they would have otherwise. MM's are playing with millions and millions of $$ which forces them to create these Liquidity Grabs.
Now let's talk about how exactly we can avoid falling victim to these liquidity grabs because they can be extremely frustrating when you get faked out and lose money.
Let's now take a look at a real example of this on the $AAPL chart below. We can see at the highlighted area, the price was driven through Supply, and immediately slapped back down.
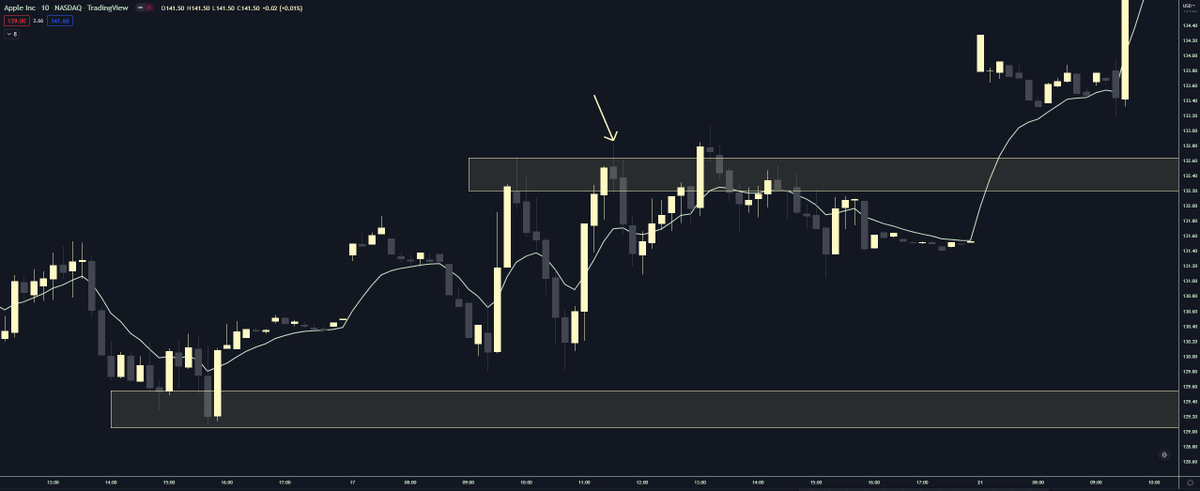
We can see that about an hour or so later, this same thing happens again as price is driven through our new Supply Zone and immediately slapped back down through.
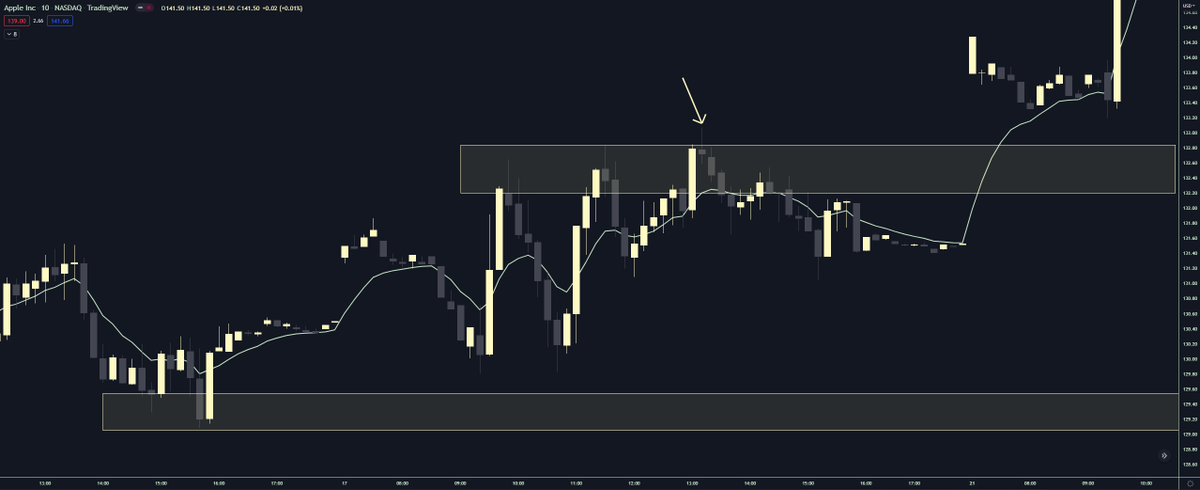
Now let's say in both scenarios we were waiting for a break of Supply to go long. Each time we in fact did get a break of our Supply Zone, but we DID NOT get confirmation on our higher timeframe. The confirmation we are looking for is a candle close out of our zone.
By waiting for a candle close instead of a break of our zone, we are greatly reducing our chances to get stopped out or lose money and fall victim to a Liquidity Grab.
Another extremely important thing we can do is knowing where our key support or resistance zones are at ALL times. By acknowledging where these areas are on a chart, we can make sure to not add a hard stop right at these key levels.
We instead want to position our hard stops below or above these key levels to reduce our chances of getting stopped out just to watch the stock do exactly what we wanted.
Below are some really great videos on how you can avoid Liquidity Grabs or Stop Loss Hunting:
With everything regarding the Stock Market, the more screen time you put in the better you will get at avoiding Liquidity Grabs. Unfortunately, this is just another one of those things that we have to experience before we can adapt.
As always I really hope this thread helps. If you have any questions please do not be afraid to reach out. Turning notifications on will allow you to see thread as soon as they are posted.

• • •

Missing some Tweet in this thread? You can try to force a refresh
 

Keep Current with Tony

Tony Profile picture

Stay in touch and get notified when new unrolls are available from this author!

Read all threads

This Thread may be Removed Anytime!

PDF

Twitter may remove this content at anytime! Save it as PDF for later use!

Try unrolling a thread yourself!

how to unroll video
  1. Follow @ThreadReaderApp to mention us!

  2. From a Twitter thread mention us with a keyword "unroll"
@threadreaderapp unroll

Practice here first or read more on our help page!

More from @Tonyss_TA

Aug 13, 2022
Something to study over the weekend: Low Volume Trend using EMA's. We have seen this quite a few times on $SPY over the course of the past few weeks / months. Extremely low volume trend days where we stair step in either direction almost the entirity of the trading day. (contd.) Image
You can see over the course of 5-6 hours from 10:45 - close, $SPY traded with very low volume. An entry off confirmation at the 9ema would have given an opportunity to ride the trend almost the entire day. Image
EMA's are best utilized during trend days, low volume or not. They offer excellent entry / re-entry opportunities with a roadmap for stop loss placement as well. Your EMA's are also there to guide you when letting a position ride and maximizing profit potential. Image
Read 4 tweets
Aug 7, 2022
The following thread will be on a Triple EMA strategy I have been testing for a few weeks and found extreme consistency with: ⬇️
So there are 2 variations to this strategy that I have been testing, a triple EMA cross in either direction, and utilizing these EMA's during extreme trend days for entries and stop placement.
Let's first discuss the triple EMA crosses I have been playing using the 9,20,30 EMA. I am sure you have played around with EMA / MA crosses depending on which you use. I have always used the 9,20 but wanted to add another that was relatively close to both.
Read 14 tweets
Jul 9, 2022
The following thread will be on Retest Trading Using Supply & Demand Zones, & why experienced traders use this method: ⬇️
Retest trading is a very proficient strategy when playing around zone breaks in either direction. Waiting for a retest of zone is the "confirmation" we need that either a zone is still valid, or a zone has flipped.
Let's first talk about zone breaks and why waiting for a retest, is much safer than taking a position right away. Whenever a Supply or Demand Zone is broken, it can often be difficult to gauge when we are supposed to enter in either direction.
Read 13 tweets
Jul 7, 2022
The following thread will be on how I draw Supply & Demand Zones using multiple timeframes: ⬇️
First things first, it is important to note that there are no restrictions when it comes to which timeframe you draw zones on. Everyone uses different timeframes, these are just the ones that personally work best for me!
We know by now that Supply & Demand Zones are areas within a chart that help us gauge entries, exits, and where "big money" is located. But how do we go about drawing these zones, and what timeframe should we use?
Read 20 tweets
Jul 5, 2022
The following thread will be on Trendline Trading & why I think they are the most important thing you can implement into your trading: ⬇️ Image
Trendlines are extremely important when it comes to, you guessed it, identifying trend. They are also extremely important in gauging entries and exits, as well as spotting potential reversals happening in real time. Image
By definition, trendlines are lines within a chart that either connect swing highs or swing lows, showing current direction in price. These lines are extremely easy to implement while keeping your charts clean and simple. Image
Read 13 tweets
Jun 30, 2022
The following thread will be an in-depth guide on Supply & Demand, what it is, and how to apply it to your trading: ⬇️
If you haven't seen my other Supply & Demand threads, here they are: Pt.1
Read 25 tweets

Did Thread Reader help you today?

Support us! We are indie developers!


This site is made by just two indie developers on a laptop doing marketing, support and development! Read more about the story.

Become a Premium Member ($3/month or $30/year) and get exclusive features!

Become Premium

Don't want to be a Premium member but still want to support us?

Make a small donation by buying us coffee ($5) or help with server cost ($10)

Donate via Paypal

Or Donate anonymously using crypto!

Ethereum

0xfe58350B80634f60Fa6Dc149a72b4DFbc17D341E copy

Bitcoin

3ATGMxNzCUFzxpMCHL5sWSt4DVtS8UqXpi copy

Thank you for your support!

Follow Us!

:(