Our latest assessment of excess deaths in Australia. This covers excess deaths from all causes to 31 March, plus excess deaths from COVID-19 only until 30 June.
A thread/
#CovidAus #ExcessDeaths #ExcessMortality
A thread/
#CovidAus #ExcessDeaths #ExcessMortality
https://twitter.com/ActuariesInst/status/1542282676199374849
Total excess mortality for March 2022 estimated at 6% (+800 deaths).
Almost half of the excess is due to doctor-certified COVID-19 deaths. Other unspecified causes and coroner-referred deaths (which includes some COVID-19 deaths) also made a significant contribution.
Almost half of the excess is due to doctor-certified COVID-19 deaths. Other unspecified causes and coroner-referred deaths (which includes some COVID-19 deaths) also made a significant contribution.

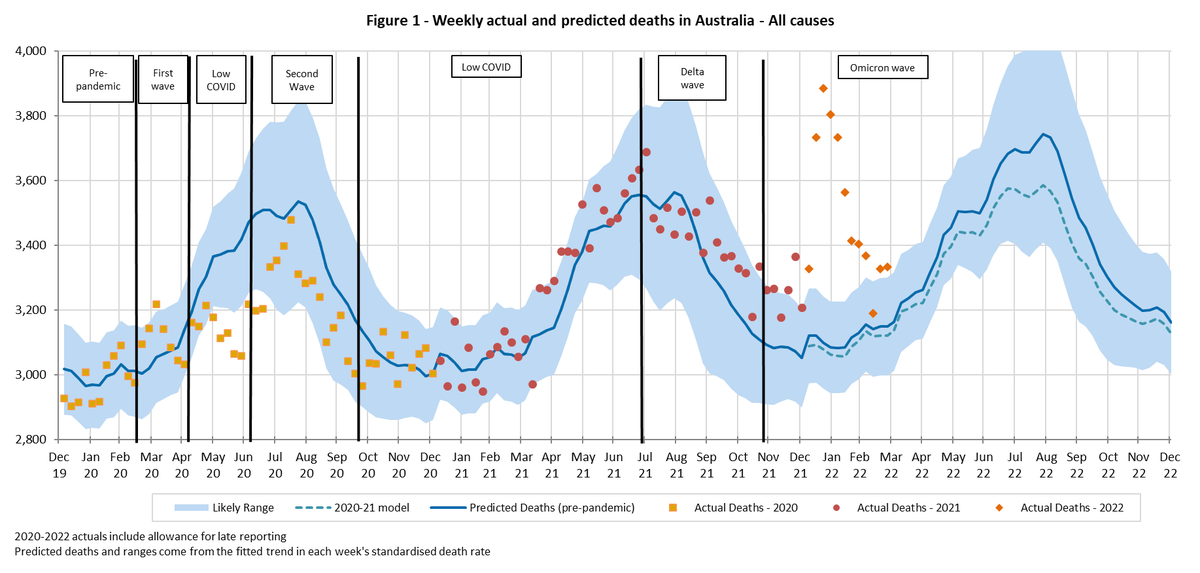
With January at 19% excess mortality and February at 14%, this takes total excess mortality for the first quarter of 2022 to 13% (+5,100 deaths).
Only one week in 2022 has been close to predicted; all other weeks have been above the 97.5th percentile.
Only one week in 2022 has been close to predicted; all other weeks have been above the 97.5th percentile.
In Q1 2022:
- 60% of excess deaths are from doctor-certified COVID-19 (+3,000 deaths)
- doctor-certified deaths from heart disease, cerebrovascular disease, diabetes, dementia, and other diseases were all higher than predicted
- coroner-referred deaths were higher than predicted.
- 60% of excess deaths are from doctor-certified COVID-19 (+3,000 deaths)
- doctor-certified deaths from heart disease, cerebrovascular disease, diabetes, dementia, and other diseases were all higher than predicted
- coroner-referred deaths were higher than predicted.

ABS data shows that in Q1 2022, there were 499 deaths in people who were COVID-19 positive at death but where COVID-19 was not the primary cause of death. i.e. COVID-19 was a contributory factor in around one quarter of the excess mortality from non-COVID-19 causes.
Daily surveillance reports show around 3,600 deaths from or with COVID-19 in Q2 2022 (900 in April, 1,300 in May, 1,400 in June).

Of these 3,600 deaths, we estimate that 22% will be deaths with (not from) COVID-19.

Thus we estimate that COVID-19 deaths alone will result in excess mortality of around 6% (+2,800) for Q2 2022, with overall excess mortality likely to be higher than this.
Combining our detailed excess death estimates to 31 March with our preliminary estimate of excess deaths due to COVID-19 only for Q2 2022, our conservative estimate is that Australia had experienced around 6,800 excess deaths across the pandemic by the end of June 2022.

These impacts by year can be separated into excess deaths from COVID-19 and other causes, noting the COVID-19 figures are for doctor-certified COVID-19 deaths only.

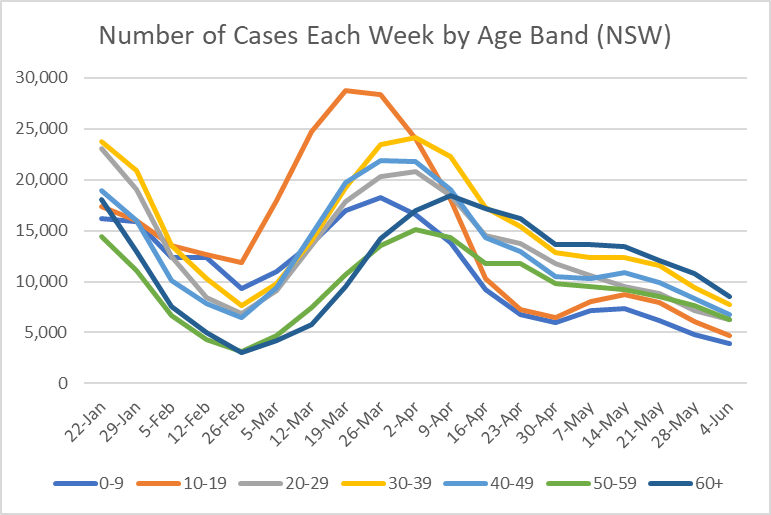
Here is the weekly chart for doctor-certified COVID-19 deaths. Charts for each cause can be found in the blog linked in the first tweet in this thread.
ends/
ends/

• • •
Missing some Tweet in this thread? You can try to
force a refresh