Reprocessing old data as I get ready for some clear skies later this week! This is the Tadpole Nebula, projected in HSO colour scheme. 100 light years across with and 12,000 light years away from us.

Right next door... is...

/1

#astrophotography
The Spider (IC 417) and Fly Nebula (NGC 1931), two stellar nurseries with young, open star clusters. Of course, the Tadpole Nebula, too, is full of young stars being created!

For a larger view...
/2
This is the full scene! For scale, the small "fly nebula" on the right is 10 light years across.

What a beautiful target!

#astrophotography

/4
Equipment:
@QHYCCD 268M camera, 5III guidecam, 7-filter wheel - @SkyWatcherUSA EQ6-R-Pro Mount - @WilliamOptics 50mm guide scope, Takahashi FSQ-85EDX Telescope, Chroma 3mm Ha, Sii, Oiii Filters
my processing skills have certainly improved - this is the same data, but with better use of technology(especially some detail extraction using a process called drizzling), and a better saturation/highlight process, I can really make the photo more vibrant with less noise.

• • •

Missing some Tweet in this thread? You can try to force a refresh
 

Keep Current with Tyler Black, MD

Tyler Black, MD Profile picture

Stay in touch and get notified when new unrolls are available from this author!

Read all threads

This Thread may be Removed Anytime!

PDF

Twitter may remove this content at anytime! Save it as PDF for later use!

Try unrolling a thread yourself!

how to unroll video
  1. Follow @ThreadReaderApp to mention us!

  2. From a Twitter thread mention us with a keyword "unroll"
@threadreaderapp unroll

Practice here first or read more on our help page!

More from @tylerblack32

Jul 8
BC Deaths per week and Cumulative excess mortality (starting in 2020), showing the consequences of the pandemic (and the startling consequence of the mismanaged heat dome event of 2021) on our populace. graph : BC deaths 2018-2022 y axis 1: deaths per week y axis
to calculate excess mortality due to drug overdoses there are two ways to do it: one is using monthly mortality to create an ARIMA projection based on the previous 5 years (the "5y" in my graph), the other is to simply compare to 2019's numbers ("2019")
In excess of expected deaths, 10,680 ADDITIONAL British Columbians died since the pandemic started. Of those, ~625 are due to the heat dome event, 2430-3422 are due to the contaminated drug supply, and 6000+ are left in the balance, likely the COVID-19 pandemic itself.
Read 7 tweets
Jul 6
"Deaths of Despair" (a health economics concept used to link alcohol, drug, and suicide deaths) is a Nobel-winning ECONOMICS concept, but it is not a good MORTALITY concept.

Alcohol, drug, and suicide deaths have very different inputs and issues.

/1 Someone in despair
The pandemic and kids probably is the best example as to why this is. Suicide deaths (graphed), alcohol-related deaths (2019: 39; 2020: 27) in young people DID NOT increase during the pandemic.

/2 Weekly Pediatric Suicide Rate in the US, 2018-2021  2020 Mar
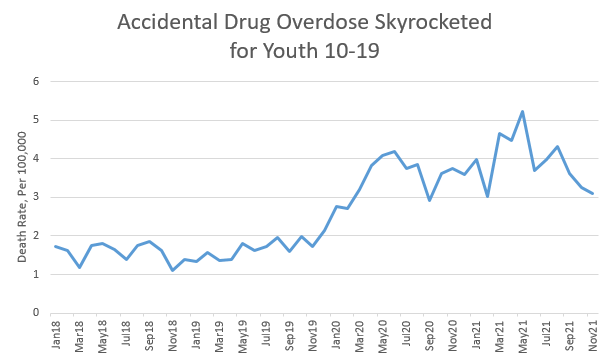
Drug overdoses, on the other hand, increased sharply, due to a tainted drug supply (no shipping, importing, smuggling, resulting in contaminated drugs, potent drugs, and synthetic drugs) that is now very difficult to resolve. Fentanyl/synthetic opioids are easy & cheap.

/3 2018-2021 on the x axis, and accidental drug overdose rate o
Read 10 tweets
Jul 4
Quite literally, many many people and organizations were specifically saying that returning to schools was necessary to protect and improve their mental health.

Its hard sometimes to be on twitter and not feel phenomenally gaslit. How someone could claim this is beyond words.
I literally wrote this op-ed in AUGUST OF 2020 because of the fearmongering, evidence free assertions that kids needed to be in school "to restore their mental health"
thestar.com/opinion/contri…
my position WAS and ALWAYS WILL BE: "School is great! but it's stressful. lets really work on school bieng LESS stressful if we are going to purport to care about things like kids dying of suicide or having ER presentations for mental health crises"
Read 4 tweets
Jul 2
Kids, suicide, school, & "shutdown"
=-=-=-=-=-=-=-=-=-=-

I posted this yesterday. In it, we clearly see that school months are associated with pediatric suicide, 2016-2019.

So, quick question... What would you expect to see in 2020, when schools were CLOSED March to June?

/1 Graph titled "Pediatric Suicides are more common during
And here it is, plain as day. When the "shutdown" occurred, children's suicides flattened out to summer rates, and held all the way through to when schools across the nation started opening up again.

/2 The same graph with the 2020 year overlayed, showing a clear
This graph is the "clincher".

In it, I compare the rate of Mar-Jun to the school year's previous months, and we can clearly see that 2020 is a significant outlier year.

The pediatric suicide rate drop after "shutdown" was unprecedented.

/3 Two graphs. Both showing the March-June rate change for pedi
Read 7 tweets
Jul 1
Kids, School, and Suicide
=-=-=-=-=-=-=-=-

People are asking about the stats I presented about school days being associated with child suicide. There are many ways to look at it.

Simply, using July as a reference month, you can easily see "school peaks."

It's very striking.
/1 graph of months vs relative suicide rate (to july). peaks ar
This is COMPLETELY UNLIKE what the graph looks like for adults (18-64), where we see small changes but undeniably summer adult suicide rates are higher than winter months.

Pediatric suicide is unique in its school month distribution.

/2 Graph of the same for adults. This time, we see that july is
We can do the same thing with days, using Sunday as reference. We drop the partial/nonschool months so we compare the days of the week for January-May & September to November.

Again, it is a striking effect. Weekdays are strongly associated with increased pediatric suicide.

/3 pediatric suicide rates relative to sunday. monday > tuesday
Read 16 tweets
Jun 30
Most schools in the United States are closed for the summer, yay! Suicide rates for kids are at an all-time low when school is out for the summer!

School days and months are associated with the 40 to 60% increase in suicide rates for kids. Image
btw this is the same data for adults, showing the classic "arrowhead" shape of mondays and summers being most related to suicide (Though the variation is much smaller)

it really is only kids, and it really is only school time Image
I'm posting a thread today that dives into this issue. Stay tuned!
Read 6 tweets

Did Thread Reader help you today?

Support us! We are indie developers!


This site is made by just two indie developers on a laptop doing marketing, support and development! Read more about the story.

Become a Premium Member ($3/month or $30/year) and get exclusive features!

Become Premium

Don't want to be a Premium member but still want to support us?

Make a small donation by buying us coffee ($5) or help with server cost ($10)

Donate via Paypal

Or Donate anonymously using crypto!

Ethereum

0xfe58350B80634f60Fa6Dc149a72b4DFbc17D341E copy

Bitcoin

3ATGMxNzCUFzxpMCHL5sWSt4DVtS8UqXpi copy

Thank you for your support!

Follow Us on Twitter!

:(