Dune Analytics might be the best place to find real-time alpha for free.
It’s home to thousands of free dashboards that display crypto data.
When used correctly, this data can make you rich.
Here’s your guide to Dune Analytics 🧵
It’s home to thousands of free dashboards that display crypto data.
When used correctly, this data can make you rich.
Here’s your guide to Dune Analytics 🧵
Dune Analytics makes it easy to view and understand on-chain data.
In this guide I’ll cover:
• Community dashboards
• Extracting data with queries
• Creating visualizations
• Creating your own dashboard
In this guide I’ll cover:
• Community dashboards
• Extracting data with queries
• Creating visualizations
• Creating your own dashboard
1. Community dashboards
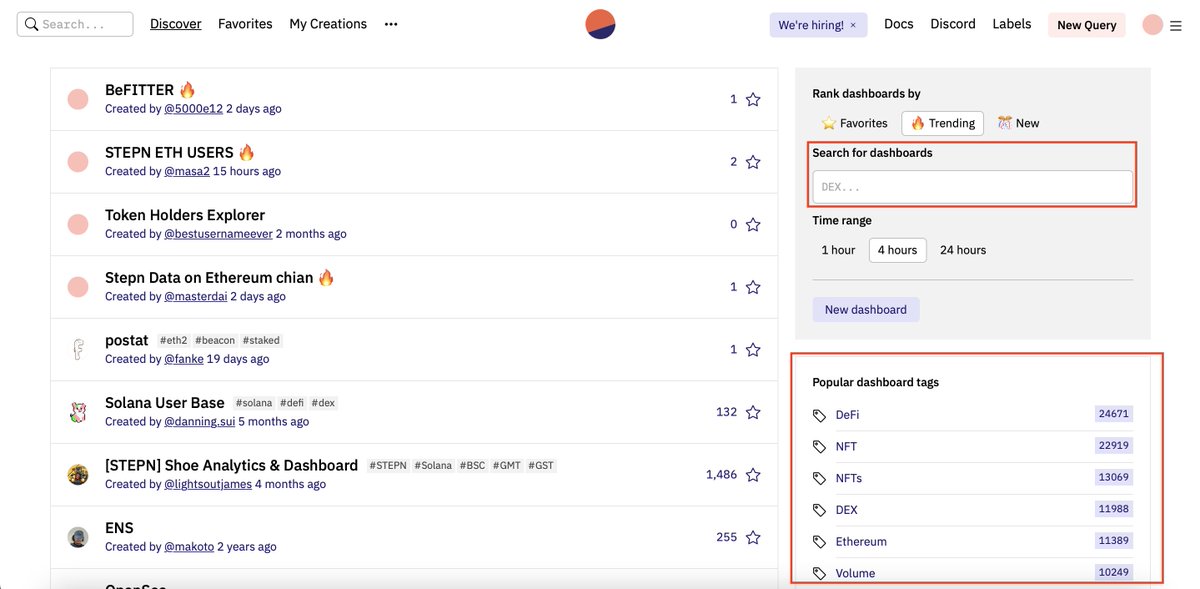
The easiest way to use Dune is to look at dashboards that others have created.
You can search for specific dashboards and filter them with tags such as DeFi, NFTs, and Ethereum.
The easiest way to use Dune is to look at dashboards that others have created.
You can search for specific dashboards and filter them with tags such as DeFi, NFTs, and Ethereum.
When you’re looking for information about a specific project, dashboards and queries by other Dune users are probably the best places to start.
Take a look at all the Uniswap dashboards available:
Take a look at all the Uniswap dashboards available:

Let’s take a look at a DEX metrics dashboard by @hagaetc.
We can see some useful stats about DEXs.
There are also some great charts and visualizations related to DEX volume and market share.
We can see some useful stats about DEXs.
There are also some great charts and visualizations related to DEX volume and market share.


You can select an individual query in a dashboard to view more information about it.
Let’s take a look at the Market share one:
Let’s take a look at the Market share one:

We now see more information about the query.
We can see the query's PostgresSQL code.
We can also see the associated views with the query.
We can see the query's PostgresSQL code.
We can also see the associated views with the query.

You can run the query to get updated metrics on the dashboard.
You can also fork the dashboard.
Forking will allow you to edit the query, fine tuning it to your requirements.
You can also fork the dashboard.
Forking will allow you to edit the query, fine tuning it to your requirements.

2. Extracting data with queries
Dune aggregates blockchain data into SQL databases.
SQL is a common database system. It’s a popular tool. Many large companies use it.
Users can query on-chain data using PostgreSQL (a simple coding language that lets you access SQL databases).
Dune aggregates blockchain data into SQL databases.
SQL is a common database system. It’s a popular tool. Many large companies use it.
Users can query on-chain data using PostgreSQL (a simple coding language that lets you access SQL databases).
Here are some PostgreSQL basics:
SQL databases are organized into rows and columns (like spreadsheets).
Each row signifies a different data record. For DEXs different rows could be Uniswap or Curve.
Columns are data values of a particular type such as price or volume.
SQL databases are organized into rows and columns (like spreadsheets).
Each row signifies a different data record. For DEXs different rows could be Uniswap or Curve.
Columns are data values of a particular type such as price or volume.
Each query returns rows or columns of data.
When creating visualizations, querying columns are most common.
Most queries are in the form:
When creating visualizations, querying columns are most common.
Most queries are in the form:

With SELECT, we choose some data (here, we are choosing the “columnName”) FROM a table (a collection of data).
For Dune, each table contains information about a project, protocol, or chain.
Optionally, we can specify a LIMIT. This limits how many rows or columns are returned.
For Dune, each table contains information about a project, protocol, or chain.
Optionally, we can specify a LIMIT. This limits how many rows or columns are returned.
We can also specify a condition using WHERE. Only data records that fulfill the condition are extracted.
It’s essentially a filter.
A common use of this is to specify a contract address.
Note that names and values are case sensitive in PostgresSQL.
It’s essentially a filter.
A common use of this is to specify a contract address.
Note that names and values are case sensitive in PostgresSQL.

Let’s take a look at a simple query.
We’re going to look at the 7 days DEX volume query.
We’re going to look at the 7 days DEX volume query.

The query extracts the usd_amount column from the dex.”trades” table.
It then applies an operation to the columns we’re selecting.
It adds all the values from the column together.
This is then converted to billions. AS is used to specify a variable name for this value.
It then applies an operation to the columns we’re selecting.
It adds all the values from the column together.
This is then converted to billions. AS is used to specify a variable name for this value.

The condition narrows down the data the query extracts. Only transactions from the past week are considered.
AND is used to chain conditions. Here the second condition is the category of transaction.
Only DEX transactions.
AND is used to chain conditions. Here the second condition is the category of transaction.
Only DEX transactions.
To summarize, the query is looking at the usd amount of all DEX transactions from the past week.
This is added together and converted to billions, and displayed as a single number.
This is added together and converted to billions, and displayed as a single number.

It’s good to know how queries work, but you’re rarely going to build queries from scratch.
Usually, you’ll fork someone else's query and edit it.
Dune also maintains a list of abstractions (custom tables). These abstractions give users access to more complex SQL operators.
Usually, you’ll fork someone else's query and edit it.
Dune also maintains a list of abstractions (custom tables). These abstractions give users access to more complex SQL operators.
All the abstractions are stored in a GitHub repository.
The repo is a huge collection of SQL scripts that you can build off of.
Here’s the link to the abstraction repo:
github.com/duneanalytics/…
The repo is a huge collection of SQL scripts that you can build off of.
Here’s the link to the abstraction repo:
github.com/duneanalytics/…
PostgreSQL is really popular, and there are a lot of great resources out there.
The official documentation is a great place to start:
postgresql.org/docs/12/index.…
FreeCodeCamp’s crash course is great too:
The official documentation is a great place to start:
postgresql.org/docs/12/index.…
FreeCodeCamp’s crash course is great too:
3. Creating visualizations
Query results are usually hard to analyze.
Visualizations present query results in a digestible format.
Dune offers several visualization options:
• bar charts
• area charts
• scatter charts
• line charts
• pie charts
• counters
Query results are usually hard to analyze.
Visualizations present query results in a digestible format.
Dune offers several visualization options:
• bar charts
• area charts
• scatter charts
• line charts
• pie charts
• counters
For a given query, you can create visualizations or edit existing ones.
Let’s look at the Monthly DEX Volume By Project query.
It has two visualizations: bar chart and table. You can switch between these views by clicking on them.
You can edit the view here as well.
Let’s look at the Monthly DEX Volume By Project query.
It has two visualizations: bar chart and table. You can switch between these views by clicking on them.
You can edit the view here as well.

When you create a visualization you can choose from several options.
Let’s make an pie chart to create a market share visualization.
Let’s make an pie chart to create a market share visualization.

Now we edit the chart options.
The option below means that we’re creating a pie chart where each section represents a project’s volume in usd.
The option below means that we’re creating a pie chart where each section represents a project’s volume in usd.

In the resulting visualization we can see the market share of different DEXs over a specified time period.
This can be extrapolated. By changing a few variables we could see things like smart contract volume across different chains.
The possibilities are endless with Dune.
This can be extrapolated. By changing a few variables we could see things like smart contract volume across different chains.
The possibilities are endless with Dune.

4. Creating custom dashboards
A dashboard is just a group of queries.
By selecting and displaying related queries together, you can get a much better understanding of a project, protocol, or ecosystem.
If you have queries, creating a custom dashboard is easy.
A dashboard is just a group of queries.
By selecting and displaying related queries together, you can get a much better understanding of a project, protocol, or ecosystem.
If you have queries, creating a custom dashboard is easy.
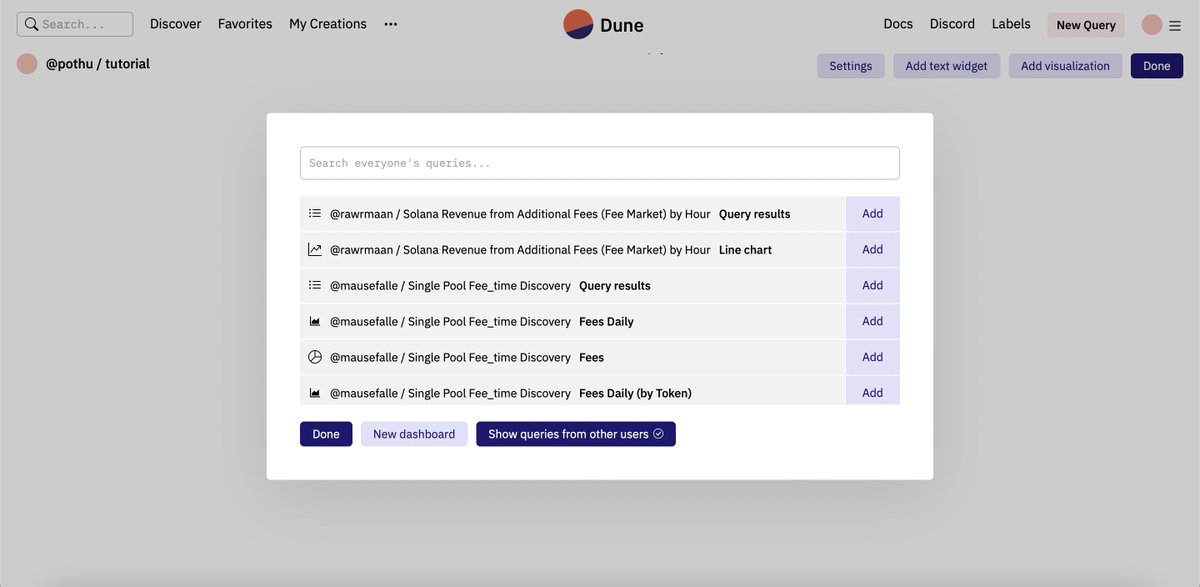
To start, head over to the Dune homepage and click on New dashboard:

Here you can name the dashboard and create a custom URL.
Dashboards are public by default, but pro users can limit who views their dashboards.
Dashboards are public by default, but pro users can limit who views their dashboards.

Click on Edit and then Add Visualization.
You have the option to add queries you’ve created as well as queries created by other users.
You have the option to add queries you’ve created as well as queries created by other users.
I added a few visualizations to a dashboard.
I created a dashboard that gives you an overview of the Ethereum NFT market.
I created a dashboard that gives you an overview of the Ethereum NFT market.

Dune makes on-chain data accessible to all.
You can do a lot with Dune. It’s a great collaboration tool.
Dune makes it possible create powerful visualizations very quickly.
By putting the right queries together, you can turn into an on-chain wizard.
You can do a lot with Dune. It’s a great collaboration tool.
Dune makes it possible create powerful visualizations very quickly.
By putting the right queries together, you can turn into an on-chain wizard.
There’s a lot more to Dune, and I’ll be posting more guides soon.
If you enjoyed this one:
1. Follow me @cryptoPothu for more.
2. Give this a RT
If you enjoyed this one:
1. Follow me @cryptoPothu for more.
2. Give this a RT
https://twitter.com/cryptoPothu/status/1552158669759848450
• • •
Missing some Tweet in this thread? You can try to
force a refresh