
MODELING SERIES: REVENUE BUILD APPROACHES 1
Crack open an elite buy-side model and perhaps the biggest takeaway will be how much works goes into the revenue build. Our job is to be right on Forecast Metrics (EBITDA, EPS, FCF) and you can't do that without being right on Revenue.
Crack open an elite buy-side model and perhaps the biggest takeaway will be how much works goes into the revenue build. Our job is to be right on Forecast Metrics (EBITDA, EPS, FCF) and you can't do that without being right on Revenue.
The FMs are simply the output of Revenue flowing through the P&L in a real-world fashion. But your FIRST and MOST IMPORTANT job in modeling out a company is to develop accuracy on the revenue line. This is hard. If you don't know a company, and their revenue growth has bounced
around the last 5 years, how do you develop an accurate revenue forecast? This is why elite LO and Tiger investors are true industry experts - they have the ability to divine the zeitgeist in an industry, see around corners, and predict the winners & losers.
I'll never forget how the consumer sector head at Maverick walked away from Ron Johnson's first investor day at JCP and said "there's no way Ron will hit his LT targets". He was right, and that industry expertise and judgment helped save us from a big error that funds others made
So at a high level, these forecasts made by senior people are a distillation of 10-15+ years of living & breathing the industry, seeing lots of successes and failures, and making bets on what will work and what won't, ultimately reflected in the revenue line of the model.
That's also ultimately why the best LO investors often don't have to do much modeling. They have the experience to distill down the 2-3 things that really matter and apply their industry knowledge to making correct bets on those drivers.
But what about the rest of us? How do you
But what about the rest of us? How do you
develop that ability early in your career? Breaking down the industry and companies with a financial modeling approach is crucial (also, accurate modeling will be in your job description as a junior).
So how do we approach developing an accurate revenue forecast? Frameworks help
So how do we approach developing an accurate revenue forecast? Frameworks help
REVENUE MODELING FRAMEWORKS
I'll give you 10 predominant modeling frameworks that I've used, and go a bit deeper into one (keeping deep dives on the 9 for another day..):
I'll give you 10 predominant modeling frameworks that I've used, and go a bit deeper into one (keeping deep dives on the 9 for another day..):
1) Mix Accelerator
2) Box Replicator
3) Mid-Cycle Mayhem
4) Data Determinism
5) Ramp Curve Radar
6) Price Umbrella
7) Wonderful Waterfalls
8) Gas to Grow
9) Quicksand or Tailwind
10) Growth Stack
Why do these work? Many market participants simply EXTRAPOLATE existing trends
2) Box Replicator
3) Mid-Cycle Mayhem
4) Data Determinism
5) Ramp Curve Radar
6) Price Umbrella
7) Wonderful Waterfalls
8) Gas to Grow
9) Quicksand or Tailwind
10) Growth Stack
Why do these work? Many market participants simply EXTRAPOLATE existing trends
and TRUST management on their outlooks. This is a no no if you want to make money consistently. Money is made at INFLECTIONS and the materialization of large EXPECTATIONS GAPS, and while I don't believe mgmt's intentionally lie, many are hopeful if not delusional w/ tunnelvision
So here's a bit on each of these revenue growth frameworks, and a little more on Growth Stack near the end.
1) Mix Accelerator: Break down the revenue composition of the business in as granular a fashion as you can. By product. By geography. By new acquisitions and divestitures.
1) Mix Accelerator: Break down the revenue composition of the business in as granular a fashion as you can. By product. By geography. By new acquisitions and divestitures.
Model each of these discrete items out. Look for growth differentials in those items. Much of the world will just take a 5% growing business and extrapolate the 5%. But what if they just divested their 2% growth business and are bulking up the 10% growing business? Model those
out discretely, and you might see the aggregate revenue growth accelerating from 5% to 8% (which is often accompanied by P/E expansion. Yippee).
2) Box Replicator: I started on the buy-side as a restaurant analyst, which taught me some great lessons. When approaching revenue,
2) Box Replicator: I started on the buy-side as a restaurant analyst, which taught me some great lessons. When approaching revenue,
you want to really think critically about HOW THE BIZ MAKES MONEY, and model in that fashion. Restaurants are easy. They get to a mature AUV (average unit volume) then comp modestly, and to grow revenues you have to add more boxes. So the real question is always, how many boxes
can you add while maintaining your unit economics? So if your business has Box Replicator characteristics, break it down that way. Model box growth and make a bet on penetration and maturity. Compare an immature CMG to how many boxes Subway has. A right call here will get you
very close to being correct on long term revenue dynamics.
3) MID-CYCLE MAYHEM: is your business cyclical? More businesses have cyclical demand than you believe! And the market tends to trade many subtly cyclical sectors peak on peak and trough on trough. Don't make this
3) MID-CYCLE MAYHEM: is your business cyclical? More businesses have cyclical demand than you believe! And the market tends to trade many subtly cyclical sectors peak on peak and trough on trough. Don't make this
mistake. I will look back as long as I can on revenue growth, preferably 20+ years, to analyze historical cycles. Has a business grown between 2-8% and averaged 5%? That mean reverting revenue growth can be dangerous when printing 8%, particularly if P/E implies it will continue
and street extrapolates it (based on mgmt HOPE). Use a mid-cycle, mean reversion framework to rise above this extrapolation bias in modeling. Maybe 8% continues, but they better have a REALLY GOOD reason why it does (and study past 8% prints that decelerated, did mgmt walk people
off a cliff then?)
4) DATA DETERMINISM: Find the data sets that correlate to your revenue growth. Obviously this is very topical for playing prints & using alternative data (which we will discuss more), but find the longer term data sets that help to forecast your revenue.
4) DATA DETERMINISM: Find the data sets that correlate to your revenue growth. Obviously this is very topical for playing prints & using alternative data (which we will discuss more), but find the longer term data sets that help to forecast your revenue.
When modeling CI back in the day, I found data Kaiser had great data on the % of industry that was ASO (admin services only) and expectations on continuation of that trend. That annual data & forecast helped me to model a continuation of the ASO line, despite concerns about
impending competition. So be creative, be a Google Machine expert, find creative data sources that correlate well with actual revenue prints, and use that data to develop more accurate forecasts.
5) RAMP CURVE RADAR: One of the trickiest modeling problems is a brand new product.
5) RAMP CURVE RADAR: One of the trickiest modeling problems is a brand new product.
You can't just model a stable 5% growing biz continuing to grow 5%. It takes some creativity. I had some lessons here from my days in pharma/biotech. When you have a new drug that you are modeling, it is quite easy to look at past ramp curves, and use your judgment on the closest
priors that inform this ramp, considering things like KOL opinions and prescriber base (specialist vs. primary care, etc). Biotech investors have to do this since they live in that world, but this lesson can be ported elsewhere. Are you an EV analyst - well, study TSLA's ramp
curve to assess other new entrant's ramps (applying judgement that obviously not every company will be TSLA). Create a library of new product ramps within your sector do pull off the shelf when new products launch. How does Facebook's launch & decel inform Tiktok? etc.
6) PRICE UMBRELLA: Work to deeply understand willingness to pay in an industry. I've been a armchair skeptic on AAPL for some (as have many HFs) since so much of the growth has been driven by pricing in a now mature volume handset market. What I missed was that people would pay
$1,200 for a phone and $1,500 for an ipad. When covering hospitals, HCA always had a nice price umbrella based on the higher commercial rates of the not-for-profits. Amazon's price umbrella in AWS was the cost of in-house data-center capacity. Understand the consumer value prop
on a deep level (i.e that an iphone isn't just an phone, but people's entries lives), and use that understanding to make a correct assessment on pricing power.
7) WONDERFUL WATERFALLS. Some of the easiest stories to get a revenue modeling edge on are waterfall stories. Where
7) WONDERFUL WATERFALLS. Some of the easiest stories to get a revenue modeling edge on are waterfall stories. Where
there is a predictable upfront sale, a ramp curve, then a replacement cycle. Generally, companies won't give you enough data to model these discrete items out, but you can use the diligence period to estimate each item close enough (be creative), then catch important inflections
by seeing when the placement cycle ends and the revenue tail diminishes. CERN in the medical records space is an example (i'll betcha a $1 that ORCL won't be very happy when the VA contract ramp is over...). Perhaps SAAS transitions should have been their own bucket here, but
ADBE pioneered the SAAS transition that skews this waterfall dynamic materially - replacing contract revenue with consistent subscription revenue. An analyst must really break this transition apart and think about the waterfall dynamics. And if you are in a SAAS story, go study
what happened at ADBE!
8) GAS TO GROW: This concept touches on cost & capex a bit, but work to understand the growth engine that drives revenue. Most businesses can't grow without capital investment & talent/infrastructure growth. I've seen this a lot in HC with revenue cycle
8) GAS TO GROW: This concept touches on cost & capex a bit, but work to understand the growth engine that drives revenue. Most businesses can't grow without capital investment & talent/infrastructure growth. I've seen this a lot in HC with revenue cycle
/ bill collection. In a low margin HC world, revenue cycle management is critical. If you don't have the talent, capital or infrastructure, you either cannot grow quickly or the growth will be disastrous. Think critically about what the business needs to grow. Is it content for
a streamer? Will Beavis & Butthead get it done for Paramount Plus? What gas does the business need to grow.
9) QUICKSAND OR TAILWIND: When I'm modeling a biz, I always like to break apart what I call quicksand vs. tailwind businesses. One way I really like to do that is to think
9) QUICKSAND OR TAILWIND: When I'm modeling a biz, I always like to break apart what I call quicksand vs. tailwind businesses. One way I really like to do that is to think
through and model out price vs. volume. Medtech is a great example. A company like ZBH has historically seen price erosion of LSD per year. This is a big hurdle to overcome! To grow 5%, that implies 8% volume growth. There are other areas in HC where pricing goes up every year,
or at least stays stable. So look for pricing dynamics & maintenance capital dynamics. Does the business have to work incredibly hard just to stand still? Or are you in a segment where there are volume AND pricing tailwinds, where incremental growth comes at a very high ROIC.
Trace that concept in the model.
10) GROWTH STACK: Last one, and, mercifully, I'll use an example on this one (one from class).
GROWTH STACK to me means starting from approaching revenue growth at high level, and ultimately making a discrete call on:
10) GROWTH STACK: Last one, and, mercifully, I'll use an example on this one (one from class).
GROWTH STACK to me means starting from approaching revenue growth at high level, and ultimately making a discrete call on:
1) TAM penetration curve
2) Market share
3) Pricing
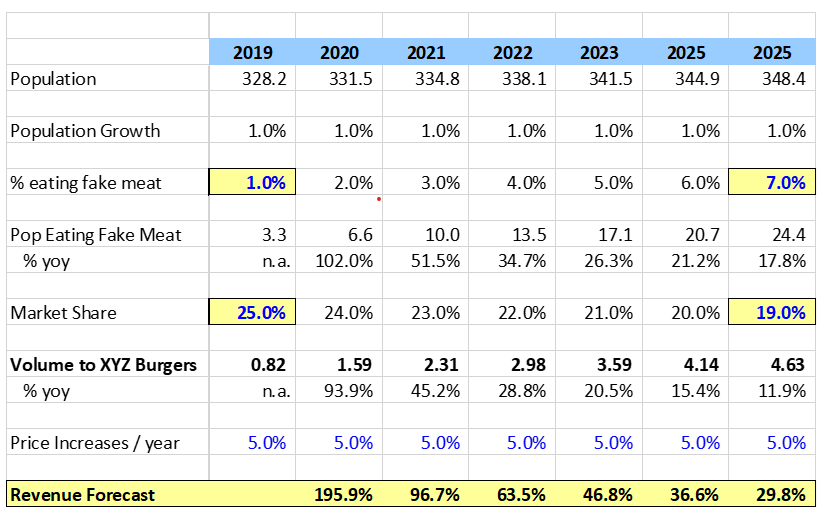
This was a hypothetical example from class of a synthetic hamburger company growing 196%. How can one even being to approach forecasting revenue here? It's difficult. So break down the problem. What % of the pop will eat
2) Market share
3) Pricing
This was a hypothetical example from class of a synthetic hamburger company growing 196%. How can one even being to approach forecasting revenue here? It's difficult. So break down the problem. What % of the pop will eat
synthetic burgers (look to to penetration momentum & consumer surveys). Ok, that's your TAM ramp. Then, what is the market share? XYZ burgers is an early entrant with 25% share, but more competition is coming, so knock that share down by 100bps a year (monitor share environment &
build an industry P&L where you connect the dots of the individual players to refine). Then, you have volumes. Layer on price and THERE YOU GO. A more accurate revenue forecast that is informed by three discrete forecasts that are grounded directly in your process.
Hope this was helpful!
• • •
Missing some Tweet in this thread? You can try to
force a refresh


