
Understanding cause & effect is hard when we can't conduct a experiment, but scientists have many tools that can help.
Let's talk about one of those tools & how it helps us learn whether policy decisions help or harm the public's health.
Get comfy, it's time for a #tweetorial!
Let's talk about one of those tools & how it helps us learn whether policy decisions help or harm the public's health.
Get comfy, it's time for a #tweetorial!
Today's #tweetorial is all about a tool called difference-in-difference analysis.
Economists & epidemiologists both use this tool, and we affectionately call it diff-in-diff or DiD since the real name is pretty long! I'm going to use DiD to save character space.
Economists & epidemiologists both use this tool, and we affectionately call it diff-in-diff or DiD since the real name is pretty long! I'm going to use DiD to save character space.
So, what is DiD? The simple answer: a way of comparing how places change over time.
We collect data on how something changes over time from Place A, e.g., COVID cases. We do the same in Place B. And then we compare the changes.
But that's only the start of why it's useful!
We collect data on how something changes over time from Place A, e.g., COVID cases. We do the same in Place B. And then we compare the changes.
But that's only the start of why it's useful!
We know that COVID cases (and many other things) are more common in some places and less common in other places, so just comparing Place A and Place B might not tell us much.
But, if Place A and Place B have followed the same *trend* in cases over time, things get interesting!
But, if Place A and Place B have followed the same *trend* in cases over time, things get interesting!
John Snow, an early epidemiologist, realized way back in 1855 that if two places had generally the same trends in health and then one of them suddenly experienced an important change, we might be able to detect the **effect** of that change by seeing how the trends diverge.
That's a little bit abstract, so let's get concrete.
John Snow studied cholera in London, UK in the 1850s (follow @NeoliberalSnow for sarcastic takes on that epidemic!)
No one knew for sure what caused cholera back then, but John Snow thought it had something to do with water.
John Snow studied cholera in London, UK in the 1850s (follow @NeoliberalSnow for sarcastic takes on that epidemic!)
No one knew for sure what caused cholera back then, but John Snow thought it had something to do with water.
He did lots of what we call "shoe-leather epidemiology", traipsing around London, wearing the soles of his shoes out talking to people about their lives, their homes and communities, and their health.
(This sort of field epi is so important and we don't do enough of it anymore!)
(This sort of field epi is so important and we don't do enough of it anymore!)
One thing that John Snow learned was cholera cases didn't seem to happen to one neighborhood all at once and then another neighborhood all at once, the way you might expect if it traveled around by air (which some people believed).
Instead, it seemed almost random.
Instead, it seemed almost random.
Now in the 1850s in London, indoor plumbing was just getting started and not everyone had access to tap water. What's more, the networks of pipes operated by each water company criss-crossed the city with no particular pattern & neighbors often got water from different companies.
Are you starting to get suspicious? John was!
He decided to start asking people not just about their health but about who supplied their water and then he added it all up!
He decided to start asking people not just about their health but about who supplied their water and then he added it all up!
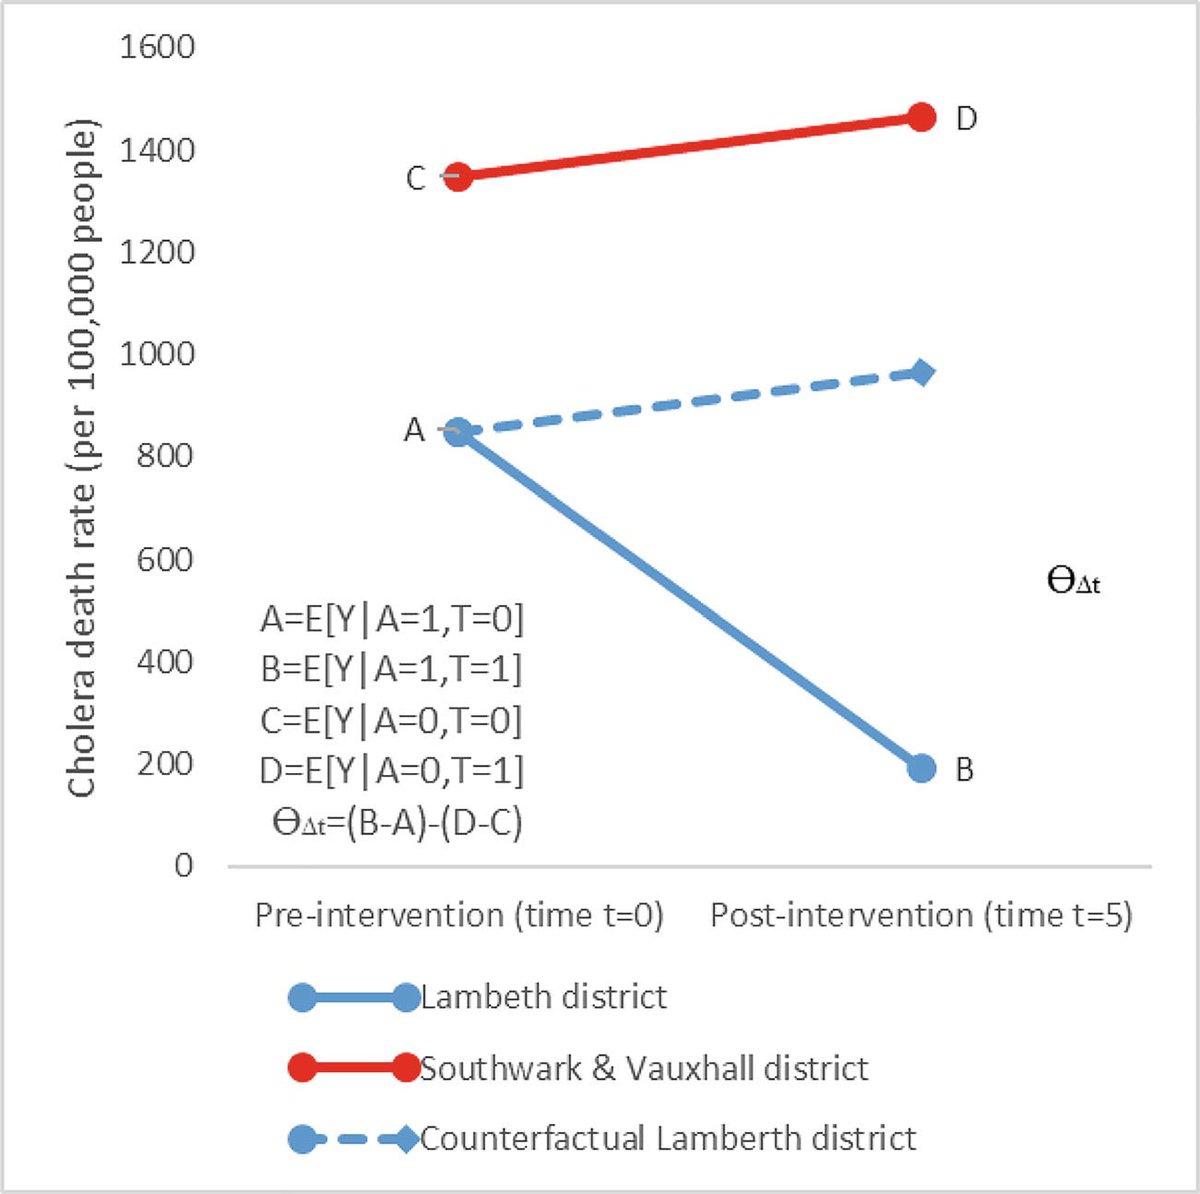
In 1849, there were 1349 cholera cases for every 100,000 customers of the Southwark & Vauxhall Company, but only 847 cases per 100,000 customers of the Lambeth Company.
That doesn't tell us much, but John Snow dug deeper and saw the same pattern in 1832. A consistent trend!
That doesn't tell us much, but John Snow dug deeper and saw the same pattern in 1832. A consistent trend!
If the houses supplied by Southwark & Vauxhall had higher cholera rates than those supplied by Lambeth in 1832 and in 1849, what might we expect to see in 1854?
Me, I would expect to see the consistent trend continue, unless something makes it change. You?
Me, I would expect to see the consistent trend continue, unless something makes it change. You?
In 1854, the Southwark & Vauxhall customers had 1466 cholera cases per 100,000 people -- an increase of 118 cases per 100,000.
If the Vauxhall customers had the same trend, we might expect about 847 *plus* 118 = 965 cases of cholera per 100,000 customers. Like this👇
If the Vauxhall customers had the same trend, we might expect about 847 *plus* 118 = 965 cases of cholera per 100,000 customers. Like this👇

Our guess of 965 cases per 100,000 isn't what actually happened!
But, since things before were pretty consistent, cholera-wise, between the companies, it's a pretty reasonable estimate of what MIGHT have happened.
In science, we call this a counterfactual estimate.
But, since things before were pretty consistent, cholera-wise, between the companies, it's a pretty reasonable estimate of what MIGHT have happened.
In science, we call this a counterfactual estimate.
A counterfactual is a thought experiment: we imagine a world that is exactly like our own in every way. What would happen in that world? Exactly the same things that happen in our world!
That's our "observed" counterfactual (kind of an oxymoron but bear with me!).
That's our "observed" counterfactual (kind of an oxymoron but bear with me!).

Now imagine changing just one thing about your imagined world? What happens to that world now?
Well, it depends on what your change causes! This new world is an unobserved counterfactual, unless we actually change our world too.
But unobserved doesn't mean unknowable!
Well, it depends on what your change causes! This new world is an unobserved counterfactual, unless we actually change our world too.
But unobserved doesn't mean unknowable!
If the thing we changed in our imagined world also sometimes changes in the real world, we can use that information to help us learn the counterfactual.
We can do the same to learn what an imagined world would be like without a change that actually happened in the real world.
We can do the same to learn what an imagined world would be like without a change that actually happened in the real world.
This is exactly what John Snow realized.
Because everything did NOT remain the same between 1849 and 1854. Something really important happened!
But, luckily for us & John, (and unluckily for the S&V customers) it happened only to the Lambeth Company, not Southwark & Vauxhall
Because everything did NOT remain the same between 1849 and 1854. Something really important happened!
But, luckily for us & John, (and unluckily for the S&V customers) it happened only to the Lambeth Company, not Southwark & Vauxhall
What happened is this:
In 1852, the Lambeth Company moved it's water intake pipes! 😱
In 1852, the Lambeth Company moved it's water intake pipes! 😱
Why was that huge? Well, both companies piped water from the River Thames to houses across London.
Before 1852, both companies got that water from the part of the river downstream of the city -- the part of the river filled with the City's dirt and garbage and sewage and ick!
Before 1852, both companies got that water from the part of the river downstream of the city -- the part of the river filled with the City's dirt and garbage and sewage and ick!
In 1852, the Lambeth Company moved their intake pipes to an *upstream* site.
This new water intake got fresher, cleaner water, uncontaminated by all the filth that washed out of London (sorry, Londoners, but you know it's true!)
This new water intake got fresher, cleaner water, uncontaminated by all the filth that washed out of London (sorry, Londoners, but you know it's true!)
That certainly sounds nice for the Lambeth customers, but why does it matter for us?
Well, John Snow and his contemporaries didn't know why people got cholera be we do: people with cholera have violent diarrhea & anyone who comes in contact with infected poop can get sick.
Well, John Snow and his contemporaries didn't know why people got cholera be we do: people with cholera have violent diarrhea & anyone who comes in contact with infected poop can get sick.
When your water for drinking and washing and everything else comes from a pipe that sucks in water right next to the sewage outflow, that's bad news for people and good news for Vibrio cholerae, the bacteria that causes cholera.
So, before 1852, customers who got their water from the Southwark & Vauxhall Company and customers who got their water from the Lambeth Company were occasionally accidentally drinking poop water. Eww!
But after 1852, the Lambeth Company customers weren't!
But after 1852, the Lambeth Company customers weren't!
So what actually happened in 1854? Lambeth cases went DOWN! From 847 per 100k to only 193 per 100k! That's a drop of 653!
But remember, we expected cases to go UP by 118! 118 up minus 653 down gives us a drop of 771!
This contrast between expected & actual differences is DiD!
But remember, we expected cases to go UP by 118! 118 up minus 653 down gives us a drop of 771!
This contrast between expected & actual differences is DiD!
So, we started by saying that DiD is when you compare how things change in Place A with how things change in Place B.
But it's really about comparing how things change in Place A, with how they *would* have changed in Place A if the world had been different in some way!
But it's really about comparing how things change in Place A, with how they *would* have changed in Place A if the world had been different in some way!
Now that we have an idea of how it works, let's get technical for a moment.
DiD is a causal inference tool designed to help us estimate a particular quantity: the causal effect of a group-level change on the outcome, among the group experiencing the change.
DiD is a causal inference tool designed to help us estimate a particular quantity: the causal effect of a group-level change on the outcome, among the group experiencing the change.
But, it doesn't necessarily tell us as much about the group that *didn't* experience the change.
It's reasonable to assume that if Southwark & Vauxhall had been the company that moved it's pipes, the cholera cases there would have gone down too. But maybe not the same amount!
It's reasonable to assume that if Southwark & Vauxhall had been the company that moved it's pipes, the cholera cases there would have gone down too. But maybe not the same amount!
Southwark & Vauxhall customers could have seen a bigger decrease, or a smaller decrease, or the same decrease.
Or, maybe John was wrong & it Lambeth change was a coincidence and they wouldn't have seen a change at all.
Or, maybe John was wrong & it Lambeth change was a coincidence and they wouldn't have seen a change at all.
Happily, John Snow wasn't wrong, and his study helped us learn about how cholera spreads AND helped us learn a new tool for assessing group-level changes like policies or company practices.
And we can apply this tool now to learn about our current policies too.
And we can apply this tool now to learn about our current policies too.
When we use DiD, the most important thing is to make sure that we are using good data to make a reasonable guess about the *expected* counterfactual for our group that experienced the change.
We call this the 'parallel trends assumption'.
We call this the 'parallel trends assumption'.
A good test of this assumption is to do what John Snow did--look at earlier data & see if things trend the same way in both places before the change we care about.
If they do, it's probably reasonable to expect that without the change, things would have continued as they were.
If they do, it's probably reasonable to expect that without the change, things would have continued as they were.
Data analysts might notice that this is a very different type of consideration than we normally make when estimating the effect of some change.
In 1849, there was a LOT more cholera in Southwark & Vauxhall households than Lambeth households. Doesn't that matter?!
In 1849, there was a LOT more cholera in Southwark & Vauxhall households than Lambeth households. Doesn't that matter?!
If we were doing a traditional analysis, where we compared each individual's water source exposure with each individual's cholera outcome it absolutely would matter that the customer bases for the companies differ so much.
There is HUGE individual-level confounding.
There is HUGE individual-level confounding.
John Snow details some of this in his book, including neighborhood home values and per capita spending.
But when we are using DiD it doesn't actually matter!! As long as the *trends* are the same, then the actual *values* aren't important!
But when we are using DiD it doesn't actually matter!! As long as the *trends* are the same, then the actual *values* aren't important!
This issue leads to lots of confusion, so it deserves more discussion, but the bottom line is that a "confounding" variable is generally only important for DiD if it ALSO experiences a change in trend *at the same time* as the change we care about.
If we were doing a randomized trial of water source & cholera, we might assign people to houses supplied by S&V or Lambeth.
If we were doing a cohort study, we would want to control for things like income and household size and neighborhood that might differ between companies.
If we were doing a cohort study, we would want to control for things like income and household size and neighborhood that might differ between companies.
But in our DiD, *none of that* matters! We don't have to know and we don't have to care!
We only have to be sure that there wasn't a massive change in the type of households that Lambeth or Southwark & Vauxhall served that occured *at the same time* Lambeth moved their pipes!
We only have to be sure that there wasn't a massive change in the type of households that Lambeth or Southwark & Vauxhall served that occured *at the same time* Lambeth moved their pipes!
This is a HUGE benefit of DiD. But it comes with a cost.
If we had done that randomized trial, we would have estimated the effect of moving the pipes on cholera rates for all customers, regardless of company. Same if we had done a cohort study.
If we had done that randomized trial, we would have estimated the effect of moving the pipes on cholera rates for all customers, regardless of company. Same if we had done a cohort study.
Instead, we have estimated the *benefit to Lambeth Company customers* of the Lambeth Company moving their pipes.
That's not nothing! It's super useful to know! But it's different from what we would get from an RCT.
That's not nothing! It's super useful to know! But it's different from what we would get from an RCT.
Okay, this is a long thread, so let's recap:
* DiD estimates the causal effect of a group-level change for the group that experiences the change
* It needs a comparison group that reflects what would have happened without the change
* Confounders that don't change, don't matter.
* DiD estimates the causal effect of a group-level change for the group that experiences the change
* It needs a comparison group that reflects what would have happened without the change
* Confounders that don't change, don't matter.
We also need a couple of other things to be true.
First, we need it to have been theoretically possible that instead of Lambeth moving their pipes, it was S&V that moved their pipes (called 'positivity' or 'overlap')
First, we need it to have been theoretically possible that instead of Lambeth moving their pipes, it was S&V that moved their pipes (called 'positivity' or 'overlap')
Second, we need also need to assume that S&V customers didn't suddenly start drinking their Lambeth neighbors' water after the pipes moved, and similarly that Lambeth customers didn't start drinking their S&V neighbors' water (called 'no interference').
Alternatively, if they *did* drink their neighbors' water, we need to assume that the amount of the time they did that didn't change when the pipes changed!
That is, if the same people drank their same neighbors' water before *and* after the change, we're in the clear.
That is, if the same people drank their same neighbors' water before *and* after the change, we're in the clear.
Third, we need to have a clear and precise definition of the change we are interested in.
That change isn't "the fecal matter content of customers' water". Instead, it is simply "pipes located downstream vs upstream".
That change isn't "the fecal matter content of customers' water". Instead, it is simply "pipes located downstream vs upstream".
John Snow made a conceptual leap when he concluded that the change in the pipes meant that cholera was coming from the water. But it's not an unreasonable leap.
Making reasonable leaps like that to explain data is part of what science is all about.
Making reasonable leaps like that to explain data is part of what science is all about.
So, now you know more than you wanted to know about difference-in-difference analyses and how to use them to estimate a causal effect and what causal effect that is and what has to be true to believe the answer tells us something real about the world.
Why did we bother learning this? Because, with collaborators at @HealthyBoston, I have a big DiD pre-print dropping soon & I want you to be prepared to read it and understand it!
So take your time on this double threaded methods #tweetorial now, so we can focus on results later!
So take your time on this double threaded methods #tweetorial now, so we can focus on results later!
Curious to learn more? Read our paper on John Snow & his analysis here: rdcu.be/b7C6o

Hungry for even more? Read an old #tweetorial I wrote for @AmJEpi on DiD using a nutrition policy example here:
https://twitter.com/AmJEpi/status/1161027852621492230?s=20&t=cbHShGUnovH0Zhty3mH57Q
@threadreaderapp unroll
• • •
Missing some Tweet in this thread? You can try to
force a refresh


