Indiaโs largest integrated power company has a presence across the power value chain.
Involved in the business of generation (Thermal, Hydro, Solar and Wind), transmission and distribution of electricity.
One of the largest renewable energy players in India and has developed countryโs first 4000 MW Ultra Mega Power Project at Mundra (Gujarat) based on Supercritical technology.
In February 2017, Tata power has become the first Indian company to ship over 1 GW Solar Modules.
๐MANAGEMENT
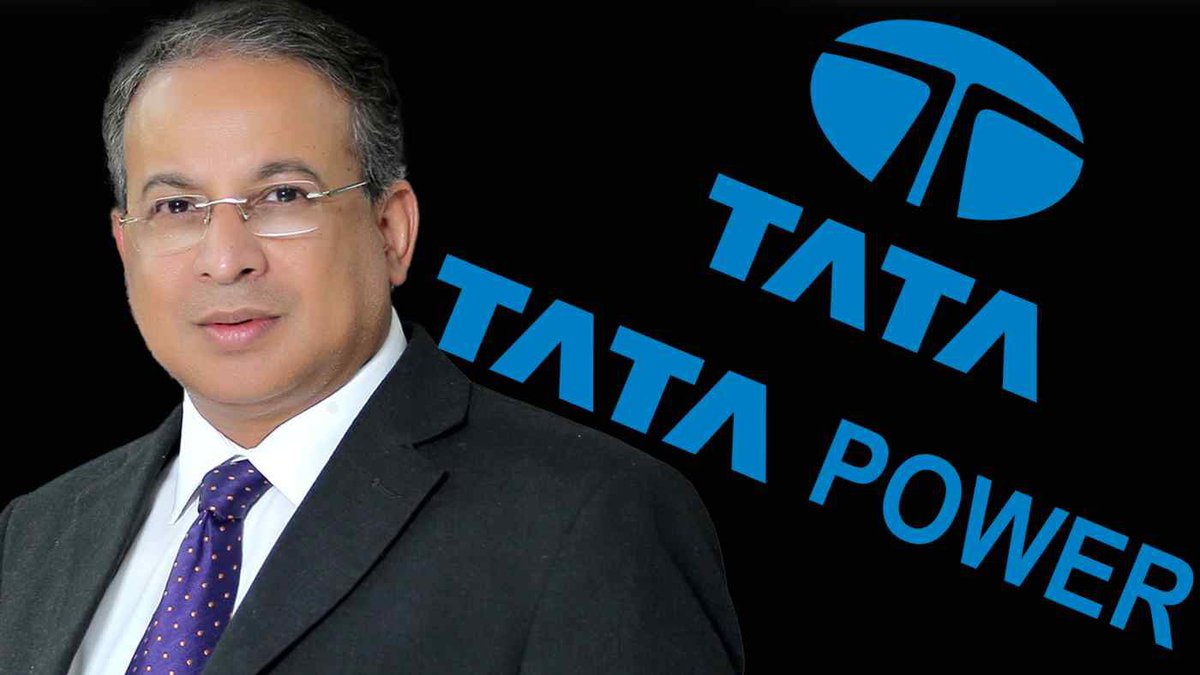
Dr. Praveer Sinha (MD & CEO) : Total 37 Years of Experience.
Joined in Tata power on 5 September 2007.
CEO from 1 May 2018 (4.2 Years).
CEO and leadership team salary has been consistent with company performance.
Average Tenure of Leadership Team is ~13 Years.
๐SHAREHOLDING PATTERN
Promoters increased the shareholding from 36.21% in Sep 2019 to 46.86% in June 2022
On the other side DII and FIIs are reduced the stake.
๐INSTALLED CAPACITY
Renewable Energy: 3,400 MW
Conventional Energy : 10,115 MW
Renewable energy is currently contributing 34% and is expected to increase by 80% in 2030 and 100% by 2040-50.
๐CLEAN & GREEN ENERGY
Tata power is steering the transformation of traditional utilities to providers of integrated solutions by initiating new business models in
EV Charging Solutions
Solar Pumps
Rooftops
Micro Grids
Home Automation
Smart Meters
๐DISTRIBUTION NETWORK
Total Sates and UTs Served : 19
Total Customers Served : 12.3 Million
๐EV CHARGING SOLUTIONS
E-Bus charging points: 242
Home Chargers installed: 18,513
public EV Chargers installed: 2,373
๐INTERNATIONAL PRESENCE
It has operations in India, Georgia, Singapore, Indonesia, South Africa, Bhutan, Zambia and Mauritius
As on 31 March 2022, Tata power had
59 Subsidiaries (44 are Wholly Owned)
32 Joint Ventures (JVs)
5 Associates
๐REVENUE BREAKUP (Product wise)
Transmission & Distribution: 65%
Generation: 17%
Renewables: 17%
Others: 1%
๐FINANCIALS (5 Year CAGR)
Sales Growth : 9.2%
EBITDA Growth : 5.3%
PAT Growth : 9%
ROCE: 9.3%
ROE: 8.42%
Net Cash Flow as on March 2022 : - 741 Cr
Overall financials are very poor but improving
๐DEBT
Debt is reducing continuously from 2017, good sign.
Still debt is on the higher side and company is paying lot of interest.
๐VALUATION
Price to Earning (PE) : 34.6 (Above itโs 5 Yr median PE 18.8)
Price to book value : 3.30
PEG Ratio : 3.94
EV to EBITDA : 17.62
By considering the future of EV and Renewables energy, stock price rallied heavily and is trading at premium valuation.
๐QUARTERLY RESULTS (Q1 FY23)
Net Sales: 14,495.48 Cr (45% Up YoY, 21% Up QoQ)
Consolidated Net Profit: 794 Cr (103% Up YoY, 57% Up QoQ)
Operating Profit declined in QoQ and YoY
๐STRENGTHS
Power portfolio, international presence, strong distribution network
Improving scale of new business, Capex to support growth
Contribution from renewable business improving
Collaboration with OEMs to roll out EV infrastructure
Improving financials
๐WEAKNESS
Poor sales growth
Low ROE and ROCE
Debt reduced but still on the higher side
High interest payment
Good competition in Renewable sector
Premium Valuation
๐CHART (Weekly Timeframe)
โข โข โข
Missing some Tweet in this thread? You can try to
force a refresh
Market Cap: 78,855.74 Cr.
Earnings per share (EPS) (TTM): 15.58
Price-Earning Ratio (PE) (TTM): 69.60
Industry PE (TTM): 73.61
Book Value / Share (TTM): 93.63
Price to Book Value: 11.58
Dividend Yield: -
No. of Shares Subscribed: 72.74 Cr.
FaceValue: 2.00
Fundamentals: Good
Valuation: Expensive
Recent Quarterly Result: Neutral
A subsidiary of global spirits leader, Diageo, manufactures, sells and distributes a portfolio of premium brands such as Johnnie Walker, Black & White, VAT 69, Antiquity, Signature, Royal Challenge, McDowellโs No.1, Smirnoff and Captain Morgan. The company is one of the largest players in the domestic India-made Foreign Liquor (IMFL) industry. Headquartered in Bengaluru, the company's wide footprint is supported by more than 50 manufacturing facilities across states and union territories in India and a strong distribution network.
United Spirits is among the top three spirits companies in the world. USL has a global footprint with exports to over 37 countries. It has established manufacturing and bottling plants in every state of India. In addition, to deliver its products to customers located anywhere in India, USL has established a robust distribution network covering the whole country. The erstwhile McDowell & Co. Limited was first established as a proprietary business in 1826.
After de-growing for 2 years, the company saw growth in FY22 at 19% in the topline followed by a modest growth of 9% in FY23. 5-year sales CAGR has been at 4% while profit grew at 12% due to margin increase and reduction in interest expenses. It has been reducing debt with almost negligible debt currently.
For FY23 Margins were at 13.5% with RoCE at 19.9% compared to 23% in FY22. Total NSV growth was down 2% from last year. Due to many govt regulatory concerns, the Revenue and operating profits were flat however, the profits jumped due to high exceptional income. The company saw โน268 crore cost savings.
In Q2 FY24, the EBITDA reached โน467 crore, reflecting a noteworthy % YoY growth of 21.4%. The standalone gross margin in Q2 FY24 recorded a YoY increase to 43.4%, with a rise of 278 basis points, and this growth was sustained on a QoQ basis. The interest cost escalated to โน26 crore, marking a significant 24.8% YoY increase due to interest on customs duty. An exceptional gain of โน31 crore during the quarter resulted from the final tranche of income from the slump sale and is now acknowledged as exceptional income post-fulfilment of customary obligations.
โช๏ธ๐๐๐๐ก๐ง๐ข๐๐๐ฅ๐ฌ
Looking at the weekly timeframe, the stock did a Rising Channel formation and currently trending within the formation. RSI & MACD are flat. This channel-biased move may continue. An immediate resistance level is 1122. On the lower side, immediate support is 1045.
Market Cap: 47,602.18 Cr.
Earnings per share (EPS) (TTM): 9.51
Price-Earning Ratio (PE) (TTM): 189.40
Industry PE (TTM): 73.61
Book Value / Share (TTM): 151.81
Price to Book Value: 11.86
Dividend Yield: 0.42
No. of Shares Subscribed: 26.44 Cr.
FaceValue: 1.00
Fundamentals: Average
Valuation: Expensive
Recent Quarterly Result: Neutral
United Breweries Limited (UBL) is engaged in the business of manufacture and sale of beer and non-alcoholic beverages. It is among the largest beer company with Kingfisher & Heineken as the brands. It has a 53% share in the Beer market with premium offerings too & exports.
The Co has 20 owned facilities and 10 contract manufacturing arrangements across India. It operates in 28 states, 8 UTs, and 50 international countries.ย The Co. has expanded its โKingfisher Ultra Draftโ offering in the lighthouse market of Maharashtra.
FY23 financial results showed recovery vs the prior year with net sales up 26.8% and EBITDA declining 11.54%. Free operating cash flows at Rs. 900 crores due to continued improvement in working capital and optimised investment levels. Renewable energy usage for the year has reached 81%. Volume growth of 3% was driven by Telangana, Rajasthan, UP and West Bengal. The premium segment recorded 19% growth. Ebitda was down, driven by inflationary pressure, negative state and route to market changes. Inflationary pressure on the cost of sales continued to impact margins even after healthy pricing of around 5% due to the cost of sales, for barley, and the packaging materials.
For H1FY24 the revenue grew by 6.38%, EBITDA de-grew by 16%, margins continued to decline, and Profits declined by 18%. However, volumes grew 7% led by 10% growth in the premium segment. Huge Price increases were taken in Rajasthan, Uttar Pradesh, Karnataka, few in Maharashtra as well. However, RM volatility persists impacting financials. The company has gained market share in Telangana and Andhra Pradesh.
Capex โน350 Cr for 2024.
โช๏ธ๐๐๐๐ก๐ง๐ข๐๐๐ฅ๐ฌ
The stock is trending up on the weekly chart and is trading above its resistance level of 1788. Technical indicators are looking strong, if the stock manages to close above 1788 then further upside may be seen, and may test 2000 - 2100 level, on the lower side 1680 may act as support for the stock.
โช๏ธJK Paper Ltd - 6599.07 Cr
โช๏ธWest Coast Paper Mills Ltd - 4811.33 Cr
โช๏ธAndhra Paper Ltd - 2300.7 Cr
โช๏ธSeshasayee Paper and Boards Ltd - 2246.49 Cr
โช๏ธTamil Nadu Newsprint & Papers Ltd - 2047.94 Cr
โช๏ธKuantum Papers Ltd - 1496.57 Cr
โช๏ธSatia Industries Ltd - 1437 Cr
Book Mark this tweet as I will be sharing Fundamentals and technicals of these companies over the weekend.
Currently this sector is available at decent valuation.
๐๐๐ ๐๐๐ฉ๐๐ซ ๐๐ญ๐
Market Cap: 6,565.19 Cr.
Earnings per share (EPS) (TTM): 72.05
Price-Earning Ratio (PE) (TTM): 5.38
Industry PE (TTM): 9.39
Book Value / Share (TTM): 272.05
Price to Book Value: 1.42
Dividend Yield: 2.06
No. of Shares Subscribed: 16.94 Cr.
FaceValue: 10.00
It is the leading player in office papers, coated papers and packaging boards. The company is a part of the prominent JK Organization.
JK Paper is one of the most respected paper companies in India today. The companyโs diversified product portfolio comprises office paper, writing, printing paper, packaging board and speciality paper. It enjoys a rich experience of ~6 decades, enabling it to emerge as one of the biggest wood-based paper companies in India and a leader in the branded office paper segment.
The Company comprises state-of-the-art integrated manufacturing facilities in three locations- Rayagada, Odisha, with an installed capacity of 2,95,000 TPA, Central Pulp Mills in Songadh, Gujarat, with an installed capacity of 1,60,000 TPA and Sirpur Paper Mills in Kagaznagar, Telangana (owned through its subsidiary), with an installed capacity of 1,36,000 TPA.
The companyโs product portfolio includes office papers, packaging boards, printing & writing paper and specialty papers. JK Paper has a global presence across 62 countries including the USA, major countries of Europe, the Middle East, Asia and Africa.
The companyโs compounded revenue and profit growth for the last 5 financial years stand at 9% and 28% respectively. The cash flows have also been healthy over the years. The return ratio profile has been fairly healthy over the past 4 years which has been aided due to improved growth in profitability. The working capital days have also been improving over the years on account of lower receivable days.
For the financial year 2022-23, the consolidated net profit amounted to Rs 1,208.22 crore, in contrast to Rs 543.82 crore in 2021-22. In terms of consolidated revenue from operations, FY23 recorded Rs 6,772.17 crore, up from Rs 4,244.33 crore in FY22.
For Q2 FY24, the company posted a stagnant quarter with muted growth in its operating profits and bottom line. Margins were around the lower end. The quarter witnessed challenges stemming from lower sales realization and higher input costs coupled with reduced demand during the quarter. However, there has been a recent positive trend in the demand for the Packaging Board, coupled with a notable increase in selling prices across all product segments.
Furthermore, the company made strategic moves during the quarter by securing Board approval for the entry into a Share Purchase Agreement (SPA) to acquire 100% shares of Manipal Utility Packaging Solutions Private Limited (MUPSPL). The acquisition, scheduled to conclude within the next four weeks, is contingent upon fulfilling conditions outlined in the SPA.
โช๏ธ๐๐๐๐ก๐ง๐ข๐๐๐ฅ๐ฌ
Trading at the resistance level and trading within an Inside bar pattern whereas technical indicators are bullish, if the price trades Inside bar 408 more upside is expected price can test the next resistance 453. Support is 364 on the weekly chart.
Market Cap: 4,798.78 Cr.
Earnings per share (EPS) (TTM): 148.11
Price-Earning Ratio (PE) (TTM): 4.91
Industry PE (TTM): 9.39
Book Value / Share (TTM): 448.42
Price to Book Value: 1.62
Dividend Yield: 1.38
No. of Shares Subscribed: 6.60 Cr.
FaceValue: 2.00
Incorporated in 1955, is engaged in manufacturing paper, paperboard and coated duplex board and is one of the oldest and largest producers of paper for printing, writing and packaging in India. The company is a flagship company of the Kolkata-based S. K. Bangur Group. The company uses Eucalyptus, Casuarina, Subabul and other hardwood as raw materials. It procures wood from Andhra Pradesh, Tamil Nadu and Pondicherry.
Manufacturing capacity is at 3,20,000 MTPA + 2,40,000 MTPA of Andhra Paper with capacity utilisation levels of 98% in FY23 vs 72% in FY21.
The Companyโs Cable Division has entered into an agreement for the supply of cables with large Indian Telcos, a large network integrator for the Tanfinet project and has a robust order book which would help it to grow the cable business. With upcoming growth in the Indian and global market with 5G and FTTH, the company is well placed to take up a growth path. For FY23 Production: 72,246 Kms of cables. The companyโs cable business makes up 7% of the business compared to paper which owns 93% of the business.
The company received approval for acquiring Uniply Decor Ltd on 20th Sep 23. The company had also acquired Andhra Paper with a 72.31% stake.
Till 2021 the company showed muted growth however post that the govt mandate of the ban of single-use plastics made the company increase its revenues substantially. The operating profits jumped in FY22-23 & FY23-24. The margins more than doubled in FY22-23. The jump in operating profits was reflected in PAT and the company started making good profits from losses. This was due to backward integration and favourable paper realization. The operating profit margin remained somewhat volatile over the past 5 years (due to the decreased demand during the pandemic), it remained in the range of 24% to 12% for the last 5 financial years. Revenue grew at a 5-year CAGR of 9.2% and gross Profits grew at 16.4%.
For FY23 Revenue grew 46% YoY & EBITDA grew 149%, and margins doubled to 33%+ due to cost optimisation. PAT rose 214%. Segment-wise Paper revenue grew 45% YoY & Ebit grew 220.5%. Cable revenues grew 61.2% and Ebit grew 100%.
For H1FY24 Revenue growth was flat, EBITDA grew 2.7% YoY, margins came in at 30% vs 29.7% YoY, and PAT grew 9%. For Q2FY24 the results were very poor with negative growth recorded. Paper and paperboard revenue declined 0.1% however PAT rose 2.75%. Cable segment revenue grew 13.6% however PAT grew 135%. The companyโs short-term borrowings declined from โน132.74 Cr to โน56.12 Cr.
โช๏ธ๐๐๐๐ก๐ง๐ข๐๐๐ฅ๐ฌ
Looks strong in the weekly chart. RSI is strong too, so more upside is expected. the nearest resistance level is 780. If it closes above the 780 level it may move toward the 810-847 levels. on the lower side, 643 will act as a strong support.
๐Top 10 Useful Websites For Fundamental Analysis
I strongly recommend beginners to do not waste money in terms of premium subscriptions. Most of the features are absolutely FREE in below mentioned websites.