How to find supply/demand using Nothing but session volume profile with no candles too.
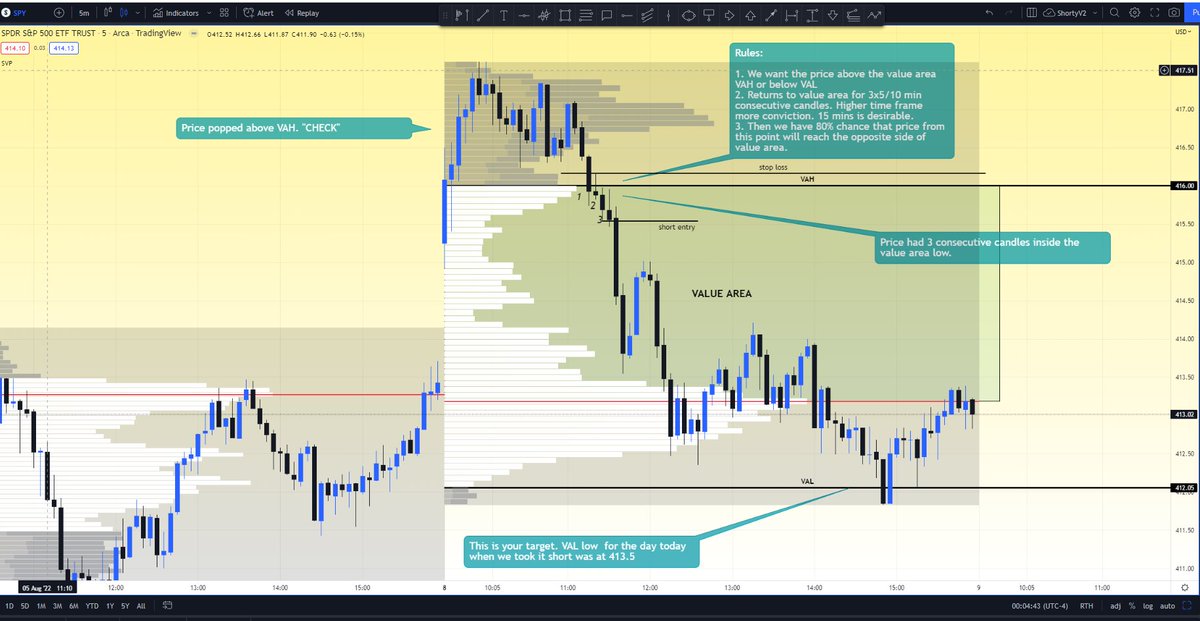
Rules:
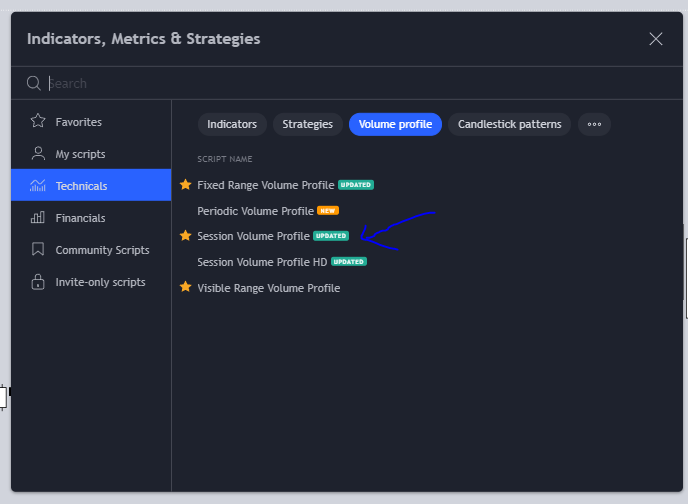
1. Use session volume profile, if using thinkorswim i suggest you use this study (tos.mx/iY5glVT) i have given this to all the members in discord as well.
2. If in TOS use
Rules:
1. Use session volume profile, if using thinkorswim i suggest you use this study (tos.mx/iY5glVT) i have given this to all the members in discord as well.
2. If in TOS use
30d30min settings. If in trading view, just make sure to use 30 mins.
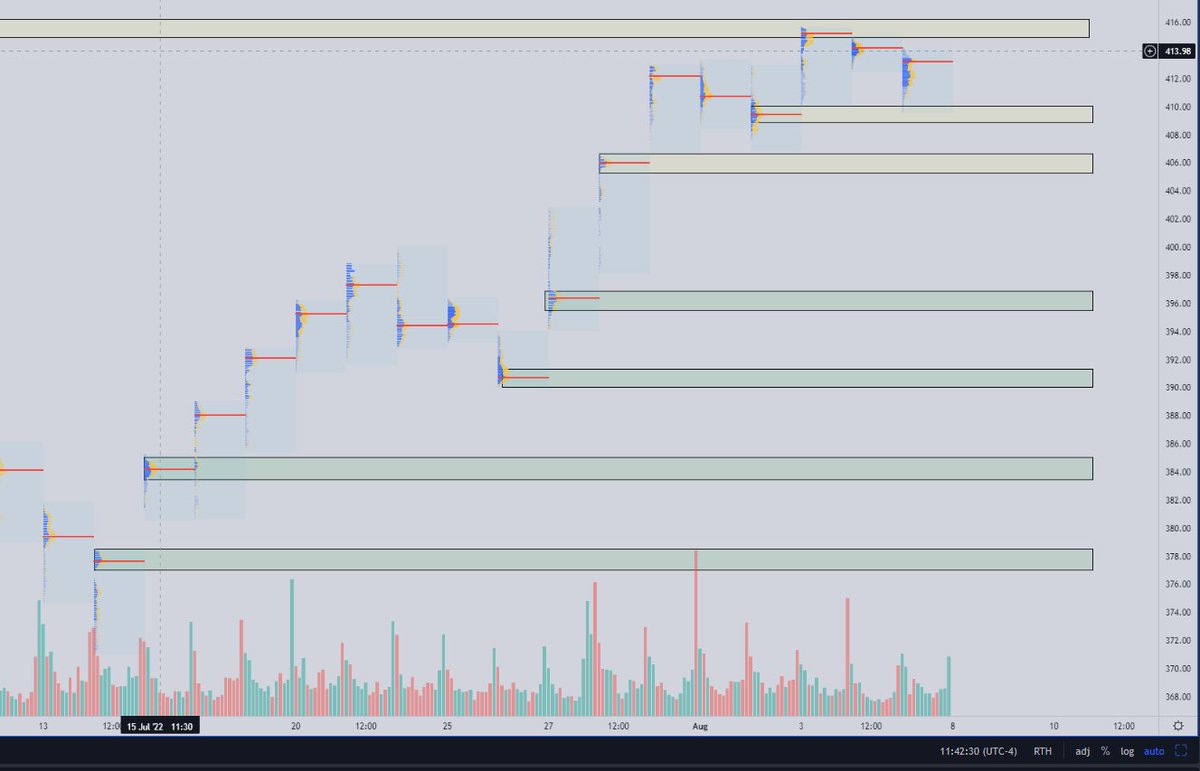
3. Virgin Point of Controls or aka Naked point of controls, dependent if you ever learned about them are "KEY". These levels tend to be MAGNETS for price to gravitate towards to up or down.
3. Virgin Point of Controls or aka Naked point of controls, dependent if you ever learned about them are "KEY". These levels tend to be MAGNETS for price to gravitate towards to up or down.
4. If you have 3-5 VPOCs above or below, rest assured you will revisit these sooner or later. AS you learn more about volume profile and relationships between session volume profile shapes you will be able to distinguish short covering rallies or true reversals. Mark your VPOCs
on charts. After each day finishes, i go back on 30 mins and find it we left a POC and never came back to it. If the VPOC is older than 30 days it loses some value but they do tend to be retested even if past 30 days. As a day trader i keep my perspective to 30 days.
5. VPOCs are your demands and supplies.
6. I use 68% for value area in my settings on TOS and TV just because of 1 std deviation, my row size is 100 on TV/TOS.
Ok so how does it look?
1. Here is a chart of $SPY and how i find demand/supply without candles.
Where to find it >
6. I use 68% for value area in my settings on TOS and TV just because of 1 std deviation, my row size is 100 on TV/TOS.
Ok so how does it look?
1. Here is a chart of $SPY and how i find demand/supply without candles.
Where to find it >
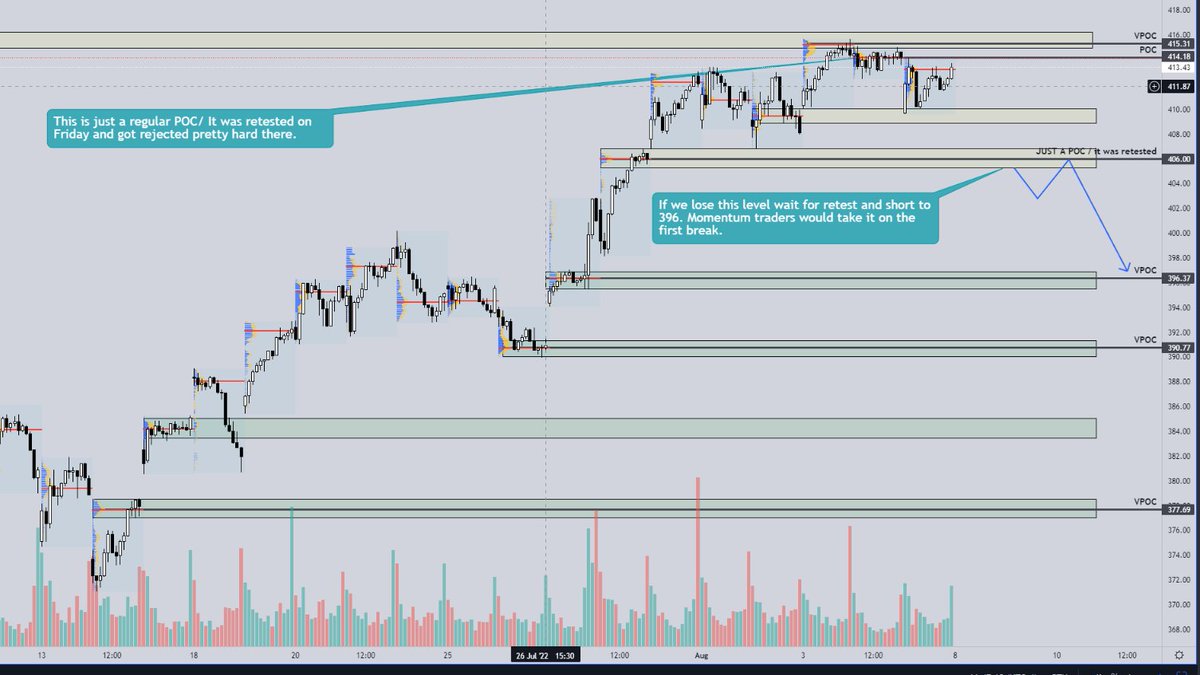
$SPY Chart with no candles, i was able to find all POCs on session volume profile. I usually draw a "box" around POC dependent on volume around the POC. Usually a nice std deviation around POC will be a good zone.
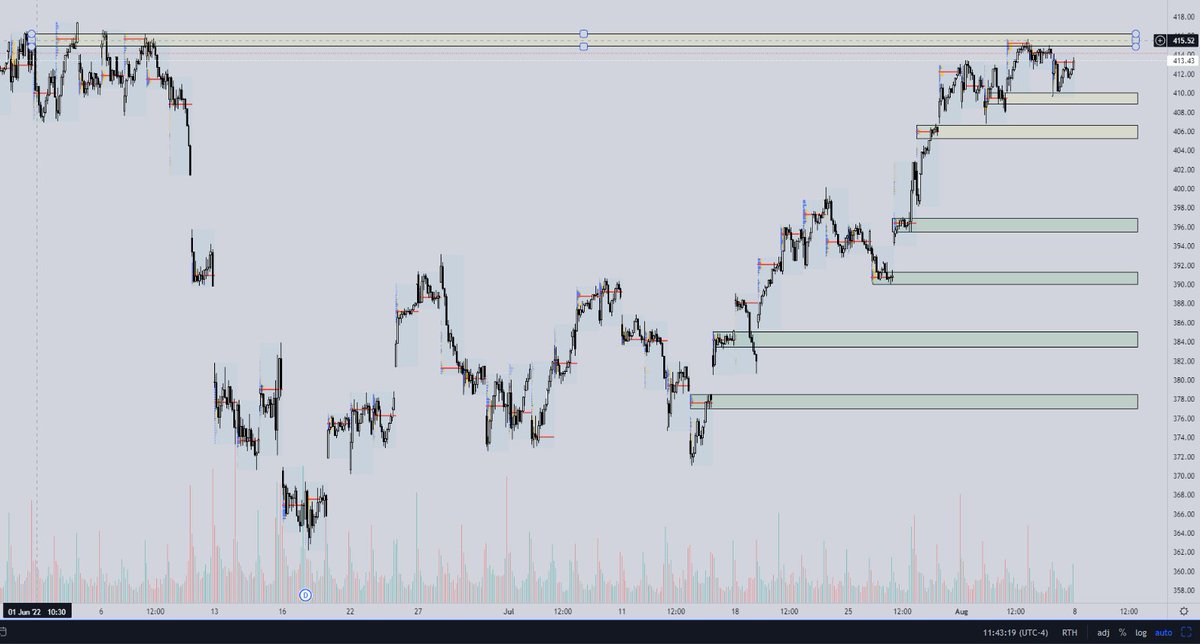
Now that we got the zones, lets turn on the candles to see what this mess looks like. Now we can see how the price reacts to these levels. The top Supply is from far left. 2nd step now that we have candles is to identify which POCs have not been retested.
Marking VPOCs:
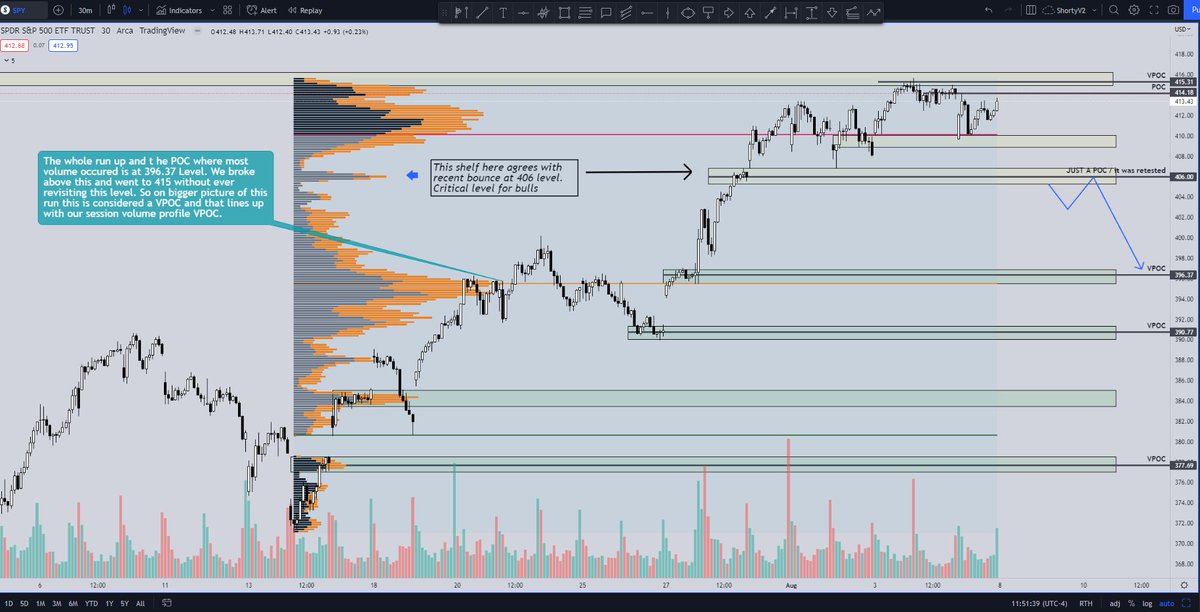
From my previous thread, the next step i do is i pay attention to the trend. Obviously lately we have been running from low 3600s on $ES_F. So i want to know where the buyers are on this whole run. I will grab Swing LOW to swing high and use fixed volume profile to see where
heavy buying occurred. If there is a POC below the current price with nice volume accumulation setup, i would wait there to go long. Take a look. Commentary on the chart itself. If you have questions, please ask in comments. We cover volume profile weekly in the discord.
@threadreaderapp
unroll
unroll
• • •
Missing some Tweet in this thread? You can try to
force a refresh