if you're wondering why climate impacts seem to be getting much worse suddenly, let me introduce you to the concept of non-linearity. A short 🧵:
In a linear system, things change in straight line. If climate impacts are linear, then every 0.1°C of warming would give you the same amount of damage.

In a non-linear world, on the other hand, every 0.1°C of warming produces larger damage than the previous 0.1°C.
This should make some sense. In a rain event, the first inch of rain does no damage, but the 20th inch of rain is going to be a catastrophe.
The reason for the non-linearity of climate impacts is that individuals and communities are impacted by climate when it passes thresholds.

Thresholds are designed into the system when assumptions of the climate are built into a system. For example, when you build a bridge, you build in the capability for the bridge to expand/contract in response to a range of temperatures that you expect the bridge to experience.
If the climate varies outside that range, the bridge may have to be closed.
mypanhandle.com/news/local-new…
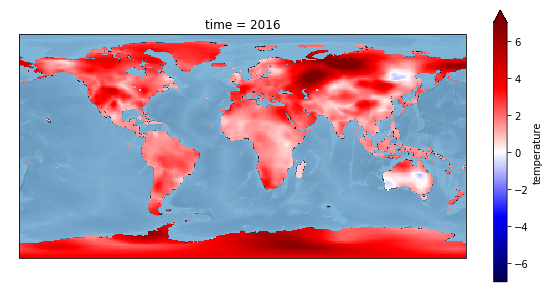
With 1.1°C of global-average warming, we are departing the climatic conditions that much of the infrastructure designed in the 20th century was designed for.

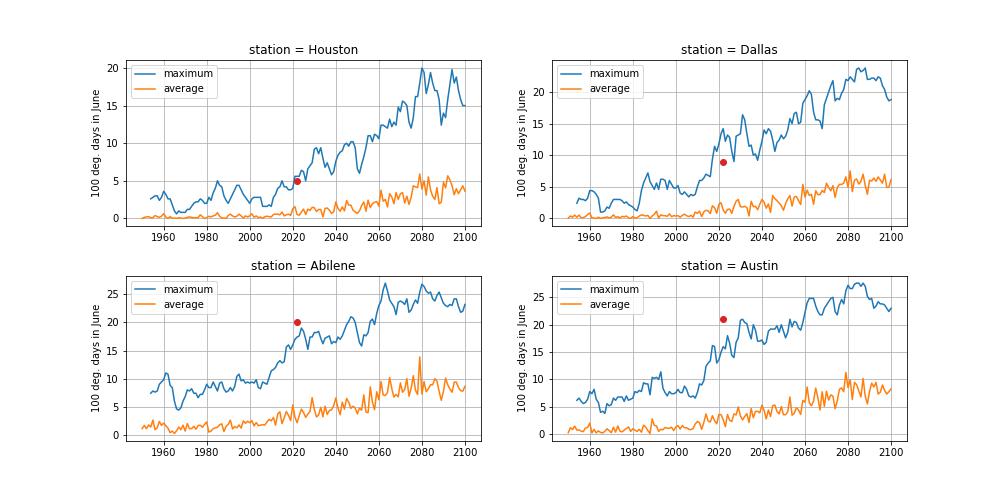
Every 0.1°C of warming is going to push us past an exponentially increasing number of thresholds in the climate system.
We can therefore expect to see worse and worse impacts coming more and more frequently as the climate continues to warm.

• • •

Missing some Tweet in this thread? You can try to force a refresh
 

Keep Current with Andrew Dessler

Andrew Dessler Profile picture

Stay in touch and get notified when new unrolls are available from this author!

Read all threads

This Thread may be Removed Anytime!

PDF

Twitter may remove this content at anytime! Save it as PDF for later use!

Try unrolling a thread yourself!

how to unroll video
  1. Follow @ThreadReaderApp to mention us!

  2. From a Twitter thread mention us with a keyword "unroll"
@threadreaderapp unroll

Practice here first or read more on our help page!

More from @AndrewDessler

Jul 22
from @MatthewCappucci and the @washingtonpost

Why the Dust Bowl was hotter than this heat wave, despite global warming washingtonpost.com/climate-enviro…
here are all of the plots I sent him (only one made it in), based on Berkeley Earth data (@RARohde)

Summertime average high temp in 1936:
Summertime average high temp in the 2016 (the globally hottest year):
Read 5 tweets
Jul 22
This is a super-interesting article about the @ERCOT_ISO grid and bitcoin miners. A few thoughts in a 🧵:
According to SEC filings, RIOT Blockchain Inc. has a long-term contract (to 2030) to buy energy from TXU at 2.5 cents per kWh.

I am shocked that TXU can sell energy that cheaply. It must be super cheap wind and solar.

sec.gov/Archives/edgar…
It also looks like they can access as much as 750 MW of power, which is about 1% of the total demand on the ERCOT grid during these sweltering summer days with temperatures > 100°F across much of the State.
Read 6 tweets
Jul 11
Conspiracy alert: if power goes out in TX today, the fossil-fuel propagandists are going to try to set wind up as the patsy.

Don't let them. 🧵
This is what I'm talking about: ERCOT is blaming extreme temps and low wind for the problem.
ercot.com/news/release?i…
So let's go over the numbers. The numbers in this 🧵 come from ERCOT's Seasonal Assessment of Resource Adequacy (SARA) made prior to Summer 2022.

ercot.com/files/docs/202…
Read 20 tweets
Jul 10
They are also a climate disaster, an air quality disaster, and a national security disaster.
And they are a disaster for democracy, as fossil fuel interests lead the erosion of our rights so they can continue pushing their product.

For example, who do you think is leading the charge to criminalize protests?
theintercept.com/2020/06/07/pip…
Read 4 tweets
Jul 9
How hot was June 2022 in TX? About as hot as it can get. Here are the number of 100+°F days in June in four cities from an ensemble of climate models.

Blue = maximum # of 100+ days in June in the ensemble
Orange = average of the ensemble
Red dot = actual # of 100+ days Image
A model ensemble is a large number of runs of climate models. Each run has a different realization of weather, so by looking at the range of predictions we can get an estimate of the worst case (the blue line) as well as the average (the orange line).
For Abilene and Austin, June 2022 was worse than any of the models predicted.
Read 5 tweets
Jun 27
Do you remember the HSBC banker who said that climate change was not a financial risk?

I did a reaction video:
tl;dr: Institutional investors only care about the next few years. If you do not care about the planet/society beyond that, then climate change may not be a big risk.
I think he understands that this is a hard position to defend, so he mixes in some standard climate-denial tropes, like adaptation will be cheap and easy.
Read 4 tweets

Did Thread Reader help you today?

Support us! We are indie developers!


This site is made by just two indie developers on a laptop doing marketing, support and development! Read more about the story.

Become a Premium Member ($3/month or $30/year) and get exclusive features!

Become Premium

Don't want to be a Premium member but still want to support us?

Make a small donation by buying us coffee ($5) or help with server cost ($10)

Donate via Paypal

Or Donate anonymously using crypto!

Ethereum

0xfe58350B80634f60Fa6Dc149a72b4DFbc17D341E copy

Bitcoin

3ATGMxNzCUFzxpMCHL5sWSt4DVtS8UqXpi copy

Thank you for your support!

Follow Us on Twitter!

:(