I've been revisiting several probability, statistics & clinical research concepts that I've learned through simulation & visualization over the past years. Full list pinned below - I hope this can be helpful for others who also learn this way! #epitwitter #statstwitter #RStats
The "birthday problem"
https://twitter.com/BenYAndrew/status/1059178107310096384?s=20&t=_JN-GENavm8Oc17e7_3IJw
The Monty Hall problem
https://twitter.com/BenYAndrew/status/1060385382494363648?s=20&t=_JN-GENavm8Oc17e7_3IJw
Bootstrap resampling
https://twitter.com/BenYAndrew/status/1075898861149814784?s=20&t=_JN-GENavm8Oc17e7_3IJw
Universality of the uniform / inverse transform sampling
https://twitter.com/BenYAndrew/status/1078358276419379200?s=20&t=_JN-GENavm8Oc17e7_3IJw
Propensity score matching & the propensity score paradox
https://twitter.com/BenYAndrew/status/1086721638782169088?s=20&t=_JN-GENavm8Oc17e7_3IJw
Directed acyclic graphs (DAGs) and the four "elemental confounds"
https://twitter.com/BenYAndrew/status/1093128915030327301?s=20&t=_JN-GENavm8Oc17e7_3IJw
Information entropy, Kullback-Liebler divergence and the Poisson distribution
https://twitter.com/BenYAndrew/status/1095382915272372227?s=20&t=_JN-GENavm8Oc17e7_3IJw
Comparison of difficulty in identifying continuous vs. dichotomous interaction effects
https://twitter.com/BenYAndrew/status/1102716888721833984?s=20&t=_JN-GENavm8Oc17e7_3IJw
Interactive application for Bayesian re-analysis of clinical trial data
https://twitter.com/BenYAndrew/status/1105128534471782400?s=20&t=_JN-GENavm8Oc17e7_3IJw
Gaussian distribution and information entropy
https://twitter.com/BenYAndrew/status/1108711262450520064?s=20&t=_JN-GENavm8Oc17e7_3IJw
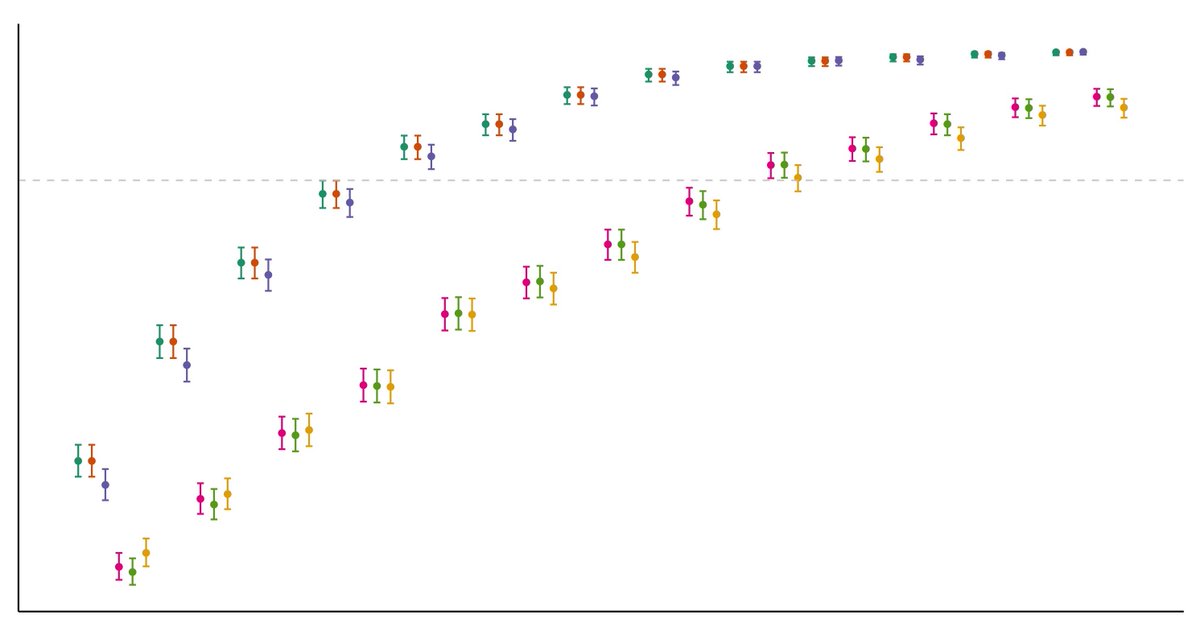
Covariate adjustment to improve power in RCTs
https://twitter.com/BenYAndrew/status/1117777383606706177?s=20&t=_JN-GENavm8Oc17e7_3IJw
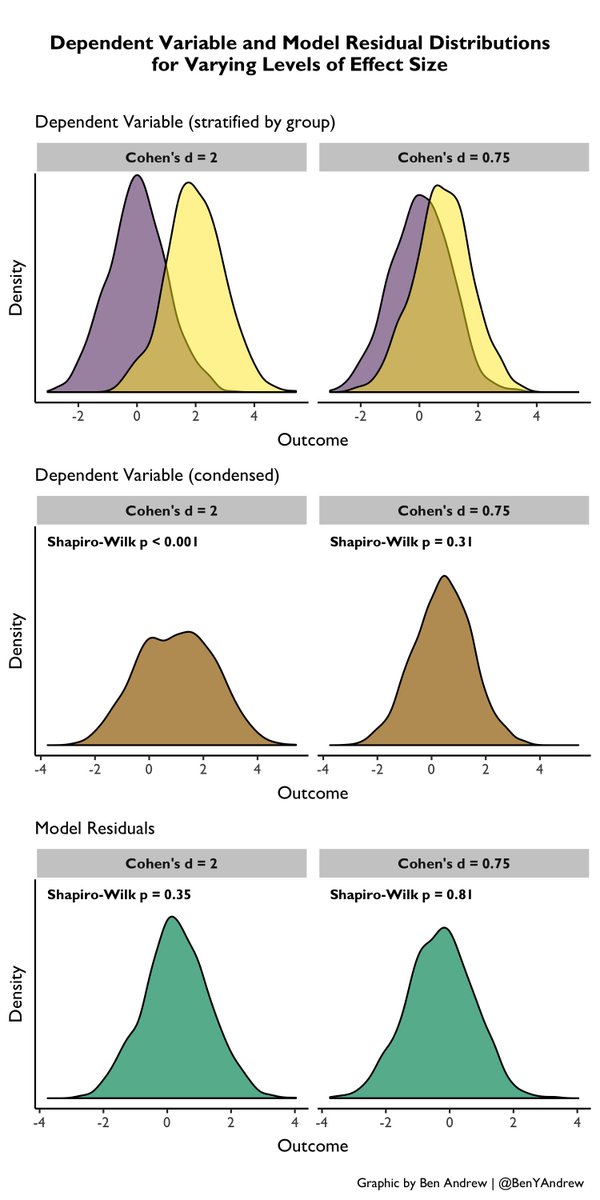
The normality assumption in statistical models
https://twitter.com/BenYAndrew/status/1124337811723816960?s=20&t=_JN-GENavm8Oc17e7_3IJw
Bayesian analysis of RCT data to derive patient-specific efficacy estimates
https://twitter.com/BenYAndrew/status/1144443400231501824?s=20&t=_JN-GENavm8Oc17e7_3IJw
• • •
Missing some Tweet in this thread? You can try to
force a refresh