
We've collected data published over the last two weeks relating to the rising #CostofLiving 📈
Around 9 in 10 (89%) adults continued to report their cost of living has risen over the past month (3 to 14 Aug 2022) ow.ly/Glul50Kpnbk
Around 9 in 10 (89%) adults continued to report their cost of living has risen over the past month (3 to 14 Aug 2022) ow.ly/Glul50Kpnbk

Around three-quarters (76%) of adults reported being very or somewhat worried about rising #CostofLiving in the past two weeks ow.ly/Glul50Kpnbk

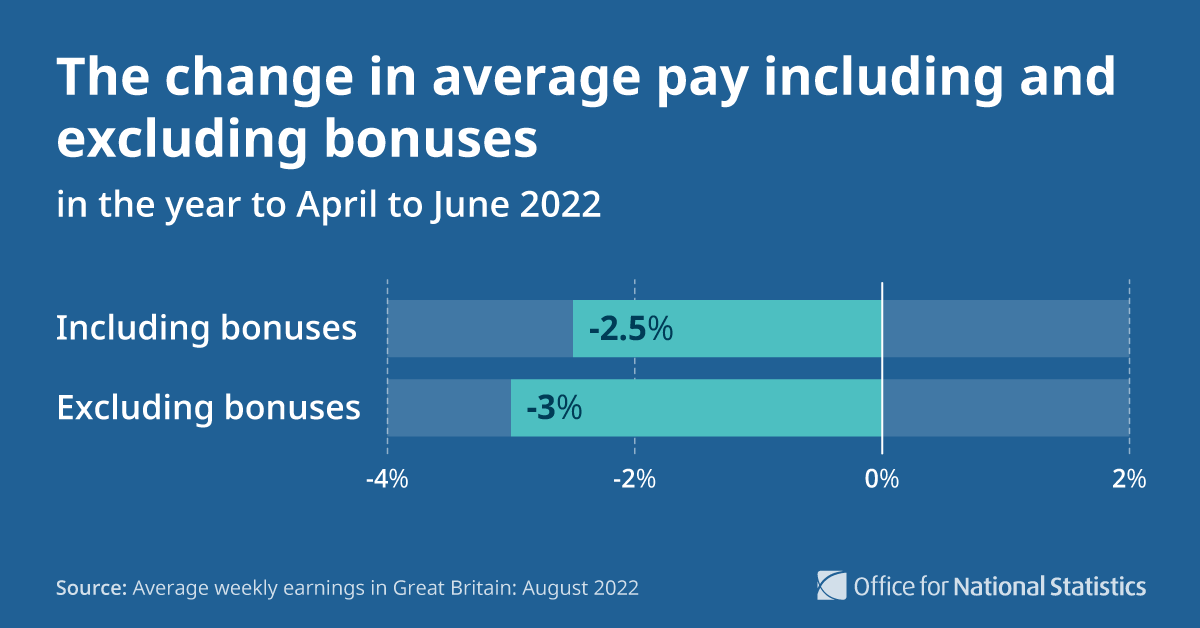
After taking inflation into account, average pay including bonuses fell by 2.5% in the year to April to June 2022.
Excluding bonuses, it fell by 3.0% – the biggest fall since records began in 2001 ow.ly/L4si50KpnfO
Excluding bonuses, it fell by 3.0% – the biggest fall since records began in 2001 ow.ly/L4si50KpnfO
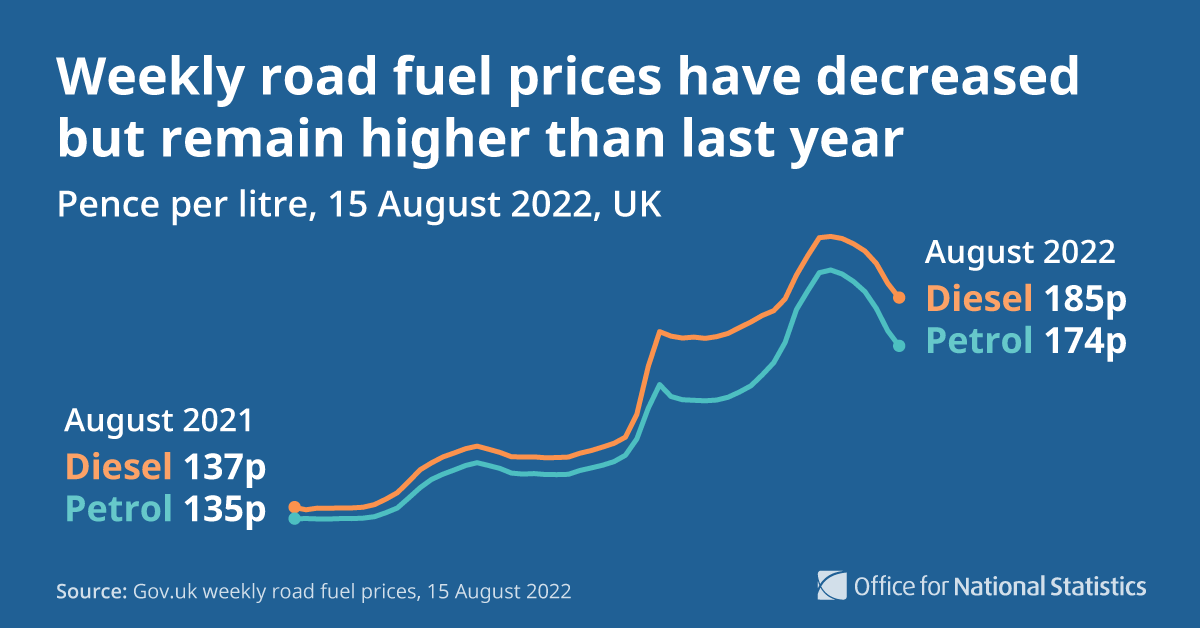
Average UK fuel pump prices have decreased in recent weeks but remain much higher than last year, according to @beisgovuk ⛽️. Compared with last year, on 15 Aug:
▪️ unleaded petrol was 39.4 pence higher per litre
▪️ diesel was 48.4 pence higher per litre
ow.ly/g2iW50Kpniq
▪️ unleaded petrol was 39.4 pence higher per litre
▪️ diesel was 48.4 pence higher per litre
ow.ly/g2iW50Kpniq
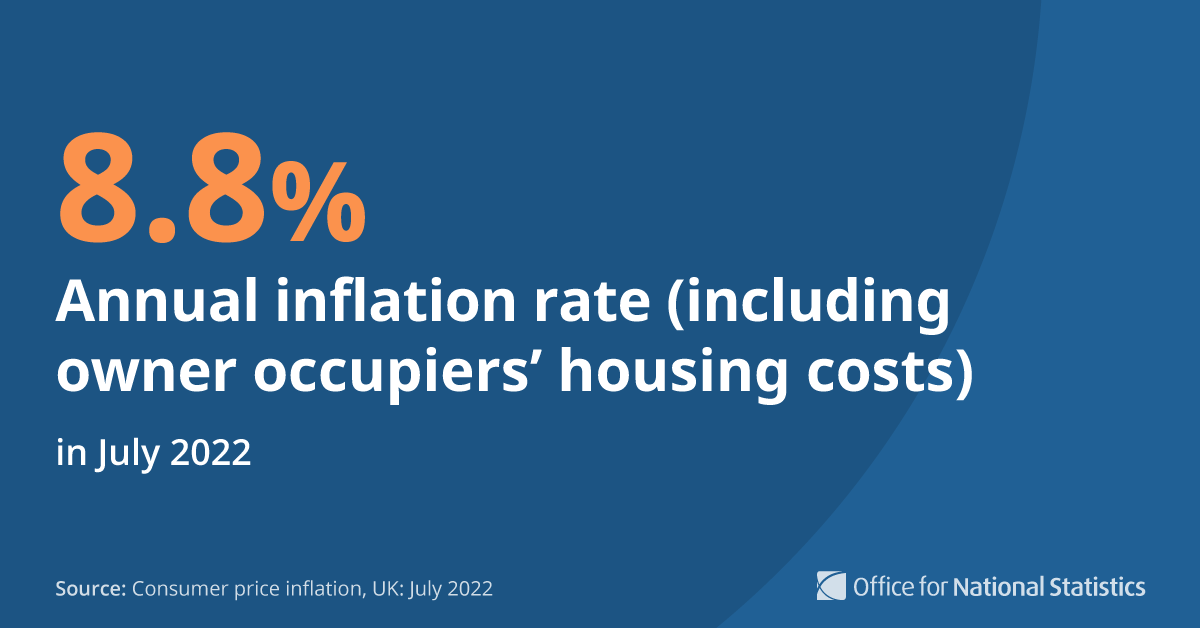
Annual inflation (including owner occupiers' housing costs) was 8.8% in July 2022, up from 8.2% in June.
The largest contributions to the July rate were:
🏠 housing and household services
🚍 transport
🍴 food and non-alcoholic beverages
ow.ly/ktWg50Kpnkj
The largest contributions to the July rate were:
🏠 housing and household services
🚍 transport
🍴 food and non-alcoholic beverages
ow.ly/ktWg50Kpnkj
Recent experimental data showed that annual inflation (including owner occupiers' housing costs) was higher in low-income households than high income households ow.ly/UnaP50KpnlY
• • •
Missing some Tweet in this thread? You can try to
force a refresh


