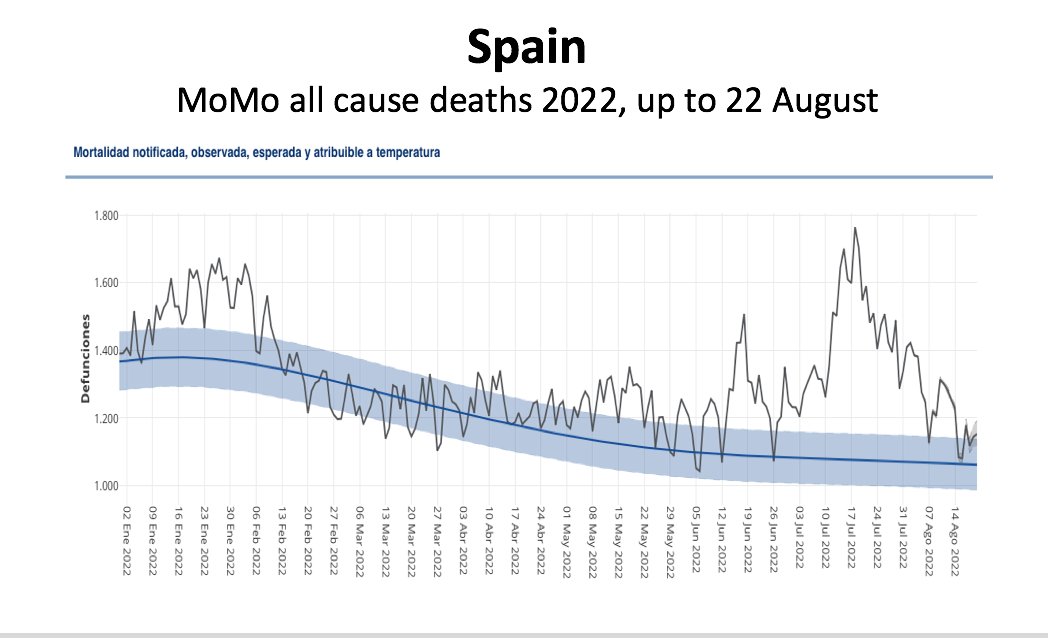
In Spain, according to MoMo's age-adjusted figures, the July excess deaths as a % over baseline is 33.7%, by far the largest excess deaths in recorded history (except March and April 2020, when the pandemic hit), higher even than in any recorded winter as % over base line. 
https://twitter.com/ChGefaell/status/1561387812364210179

Here is the series from 2015 to 2019.
(2015 is the first year recorded by MoMo's age-adjusted excess deaths model. In that year 2015 Spain experienced one of the worst respiratory disease seasons in its recent history).
(2015 is the first year recorded by MoMo's age-adjusted excess deaths model. In that year 2015 Spain experienced one of the worst respiratory disease seasons in its recent history).

If the non-Covid excess was due to some sort of collateral damage from lockdowns, medical delays or having passed Covid, it would be unlikely that the delayed effects of that would show up in waves, synchronously in many people at once, as we see in Spain and several countries.
The largest part of the age-adjusted excess deaths in Spain since May are due to unknown causes (undisclosed by the government).

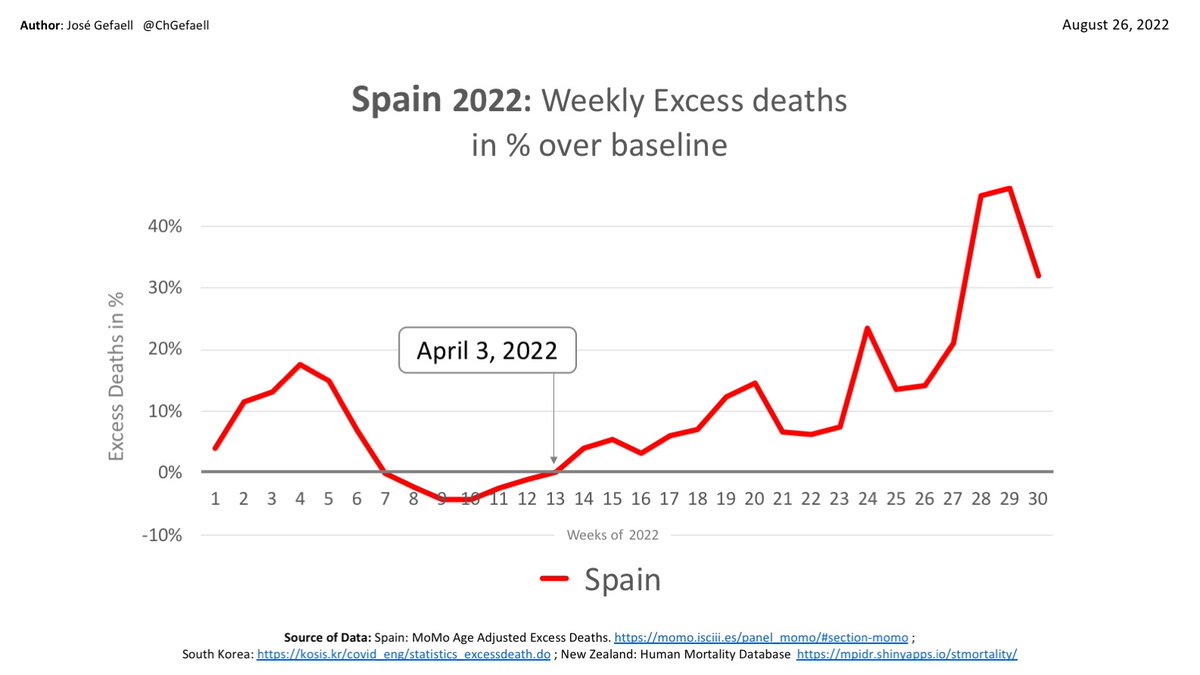
Spain: MoMo Age-adjusted Excess Deaths in % over adjusted expected deaths (since in an aging population expected deaths are >than the simple historical avg). July 2022 is the largest excess in recorded history, except for Mar-Apr 2020. Also if we exclude deaths attributed to heat

Spain: MoMo Age-adjusted Excess Deaths in % over adjusted expected deaths. July 2022 is the largest excess in recorded history, except for Mar-Apr 2020. Also if we exclude deaths attributed to heat. This extraordinary 2022 excess deaths started in May.

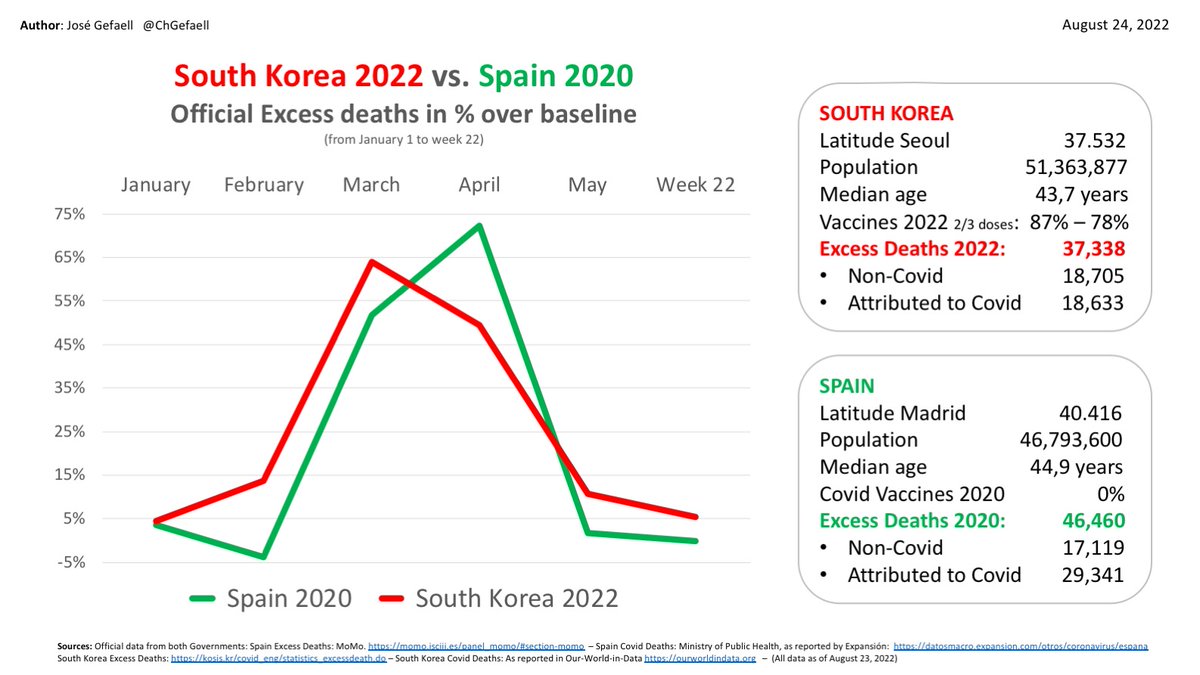
South Korea, a country with a pop equivalent to Spain and approximately the same latitude. With no heat or cold, Korea has had a large wave of excess deaths in Mar-Apr 2022:
Excess deaths 2022: 37,338
Non Covid Excess: 18,705
Attributed to Covid: 18,633
kosis.kr/covid_eng/stat…
Excess deaths 2022: 37,338
Non Covid Excess: 18,705
Attributed to Covid: 18,633
kosis.kr/covid_eng/stat…

South Korea, with no heat or cold, it has had a large wave of excess deaths in Mar-Apr 2022. Note that in several weeks the excess was >70% (excess is calculated over 3y max).
Excess deaths 2022: 37,338
Non Covid Excess: 18,705
Attributed to Covid: 18,633
kosis.kr/covid_eng/stat…
Excess deaths 2022: 37,338
Non Covid Excess: 18,705
Attributed to Covid: 18,633
kosis.kr/covid_eng/stat…

Until 2022 Korea had virtually no excess deaths from Covid or other causes. This spring it has experienced a strong wave of excess deaths (Covid & non-Covid) quite equivalent to that of Spain in 2020. But Korea is now almost 90% vaccinated and 78% have 3 doses(highest with Japan)
Japan has the highest % of third doses (84%). Like many other countries (each at different times), in 2022 Japan shows a significant non-covid excess deaths off-season: mainly between Feb and April, 32,449 died in excess from non-covid causes.
Source: exdeaths-japan.org/en/graph/weekly
Source: exdeaths-japan.org/en/graph/weekly

Japan 2022 age-adjusted excess deaths data were taken from: exdeaths-japan.org/en/graph/weekly

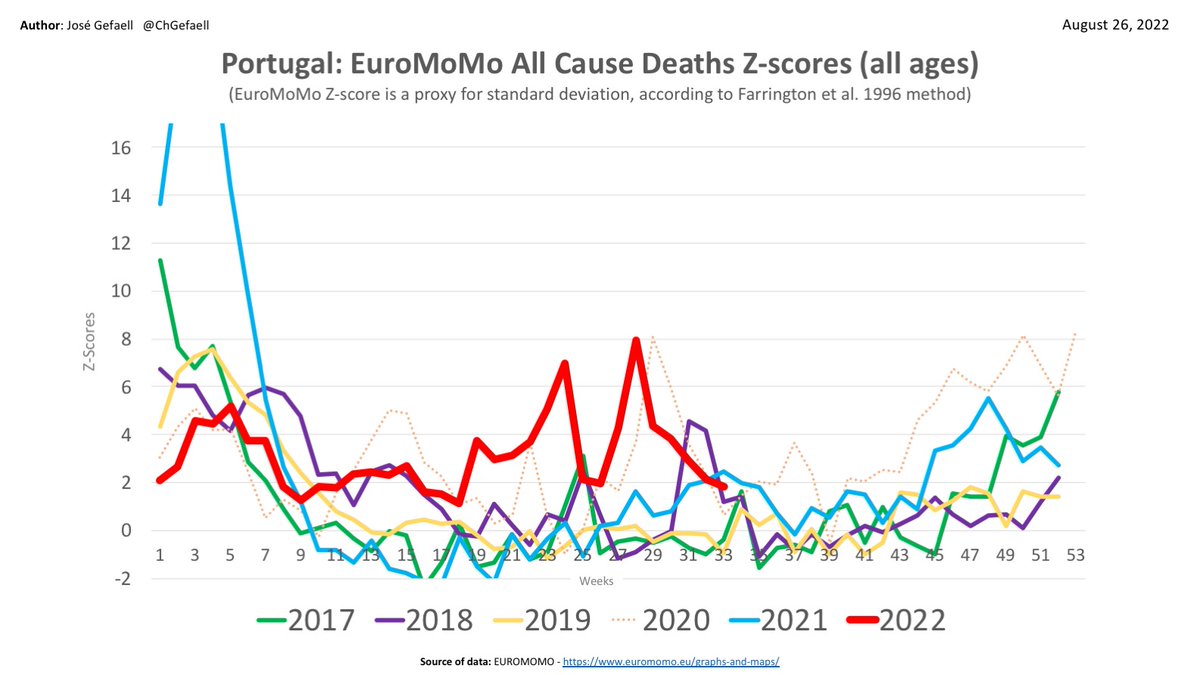
Update week 33 of excess deaths in Europe, according to EuroMoMo z-scores. Only Spain and Europe as a whole.
Download the entire presentation in PDF: dropbox.com/s/7e0iswcttoh9…
Download the entire presentation in PDF: dropbox.com/s/7e0iswcttoh9…
Japan again zooming in

If heat were the cause of excess deaths in Europe, Portugal should have ~the same excess as Spain and, although the excess there has been significant, it has not been as extraordinary as in Spain (since April). And what about excesses in Korea or Japan at other times of the year?


NEW ZEALAND
Latitude Wellington: -41.276
Population: 4,907,888
Median age: 38,0 years
Vaccines 2/3 doses: 84% – 63%
Excess Deaths 2022 (up to July 27): 2,704
Non-Covid excess deaths: 1,420
Attributed to Covid: 1,284
Latitude Wellington: -41.276
Population: 4,907,888
Median age: 38,0 years
Vaccines 2/3 doses: 84% – 63%
Excess Deaths 2022 (up to July 27): 2,704
Non-Covid excess deaths: 1,420
Attributed to Covid: 1,284

Spain vs. New Zealand
2022 weekly all cause excess deaths in % over baseline of the two antipodean countries. Excess deaths have been on an upward trend in both countries since quite early in the year (NZ earlier).
2022 weekly all cause excess deaths in % over baseline of the two antipodean countries. Excess deaths have been on an upward trend in both countries since quite early in the year (NZ earlier).

Now comparing Spain, New Zealand and S. Korea. In the three countries ~half of the excess is due to non-Covid causes. Korea's wave of excess deaths is extraordinary. As we saw earlier in the thread, it's equivalent to Spain's first wave in 2020 (which had been one of the largest)

I'm extremely surprised that the media are only giving the "scoop" on Spain's historic excess deaths only now, at the end of August, when the excess began its almost unchanged escalation on week 13, ending April 3. As detailed above, >50% is from unknown, non-Covid or heat causes
For those who don't see anything wrong in the "derivative data" (excess deaths), perhaps more convincing is the official graph produced by the Spanish government with raw numbers of registered deaths.
Source: momo.isciii.es/panel_momo/#se…
Full presentation here: dropbox.com/s/7e0iswcttoh9…
Source: momo.isciii.es/panel_momo/#se…
Full presentation here: dropbox.com/s/7e0iswcttoh9…

• • •
Missing some Tweet in this thread? You can try to
force a refresh