Are you a swing trader or a mid/long term investor and wondering when is the right time to buy?
There is no need to buy random price levels blindly.
As a trader of 5 years, mainly focusing on Technical Analysis I will teach you how you can maximize your profits 👇🏽
There is no need to buy random price levels blindly.
As a trader of 5 years, mainly focusing on Technical Analysis I will teach you how you can maximize your profits 👇🏽
Condition: Trend change/reversal.
Have you heard the popular investor saying: “the trend is your friend?” Well it’s true, actually the trend is your best friend.
Let me explain.
Have you heard the popular investor saying: “the trend is your friend?” Well it’s true, actually the trend is your best friend.
Let me explain.
You don’t want to be buying something that just entered a high timeframe bearish trend.
• You want to be buying when the bearish trend flips into a bullish one.
Okay easier said than done.
How can we determine when an asset flips a high timeframe trend? 🤔
• You want to be buying when the bearish trend flips into a bullish one.
Okay easier said than done.
How can we determine when an asset flips a high timeframe trend? 🤔
Answer is with MAs - short for moving averages.
What are MAs? Shortly and lightly explained MAs are an indicator that follows the price with a delayed line. They are useful to show how an asset is trending.
Let’s slap on some MAs and look at some charts.
What are MAs? Shortly and lightly explained MAs are an indicator that follows the price with a delayed line. They are useful to show how an asset is trending.
Let’s slap on some MAs and look at some charts.
MAs can be used in many ways. I will consider doing an in depth tutorial on MAs in the future.
In this tutorial I will only be teaching you how you can spot a trend and a trend reversal.
It’s now you will probably ask, does it matter which length I use on the MAs?
In this tutorial I will only be teaching you how you can spot a trend and a trend reversal.
It’s now you will probably ask, does it matter which length I use on the MAs?
The answer is complicated, so let’s keep it simple. For now I would recommend using the standard SSMA 25, 99, 150 and MA 50, 99, 200 if you are looking at higher time frames for older charts (2D, 3D, 1W +)
more MAs used = more confirmation about the trend and what phase it is in.
It’s important not to overdo it and add too many otherwise you will end up with a chart that has a lot of noise.
It’s important not to overdo it and add too many otherwise you will end up with a chart that has a lot of noise.
Alright let's go!
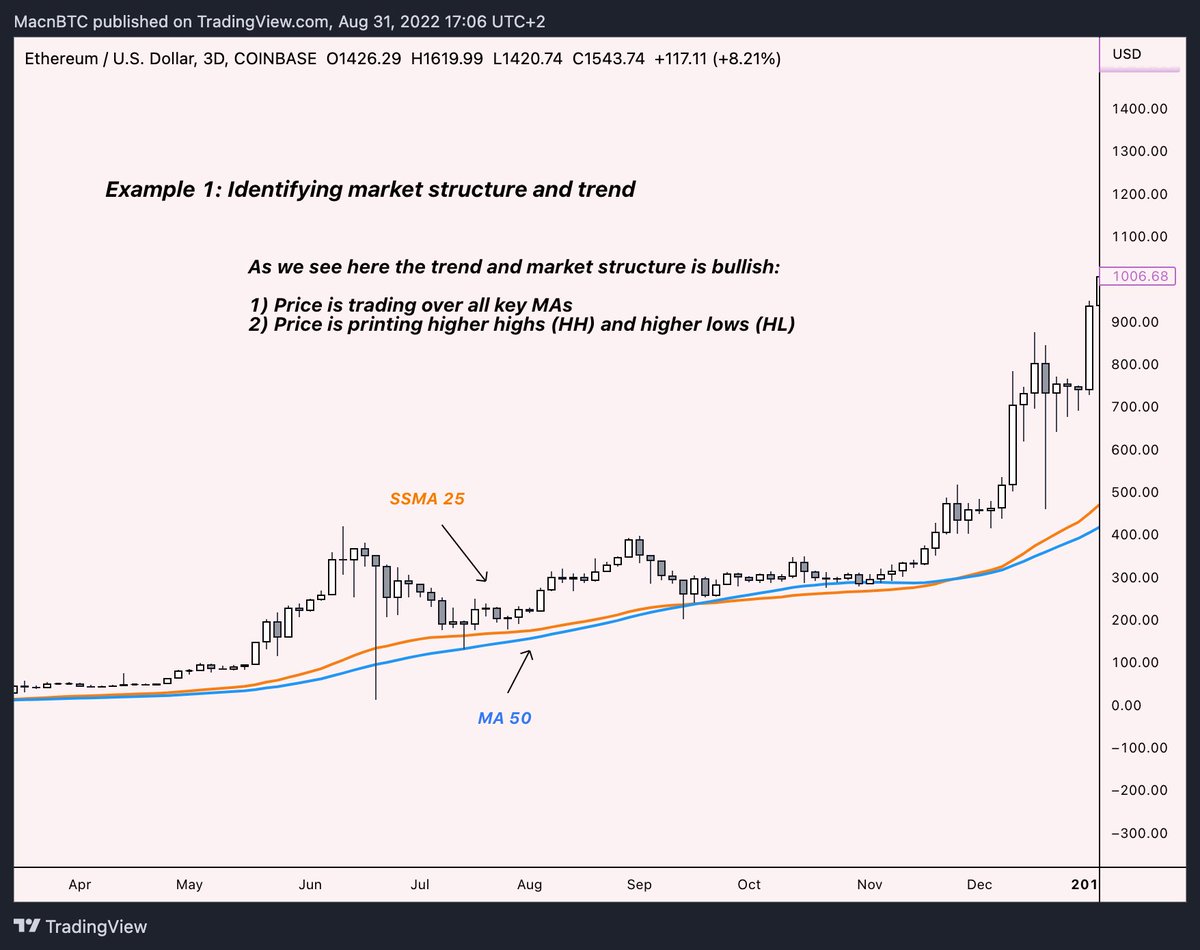
This is $ETH on a 3D timeframe with SSMA 25 and MA 50.
I will only use 2 moving averages to reduce the noise on the chart.
This is an example of a bullish trend and market structure, click on the chart and read the notes.
This is $ETH on a 3D timeframe with SSMA 25 and MA 50.
I will only use 2 moving averages to reduce the noise on the chart.
This is an example of a bullish trend and market structure, click on the chart and read the notes.
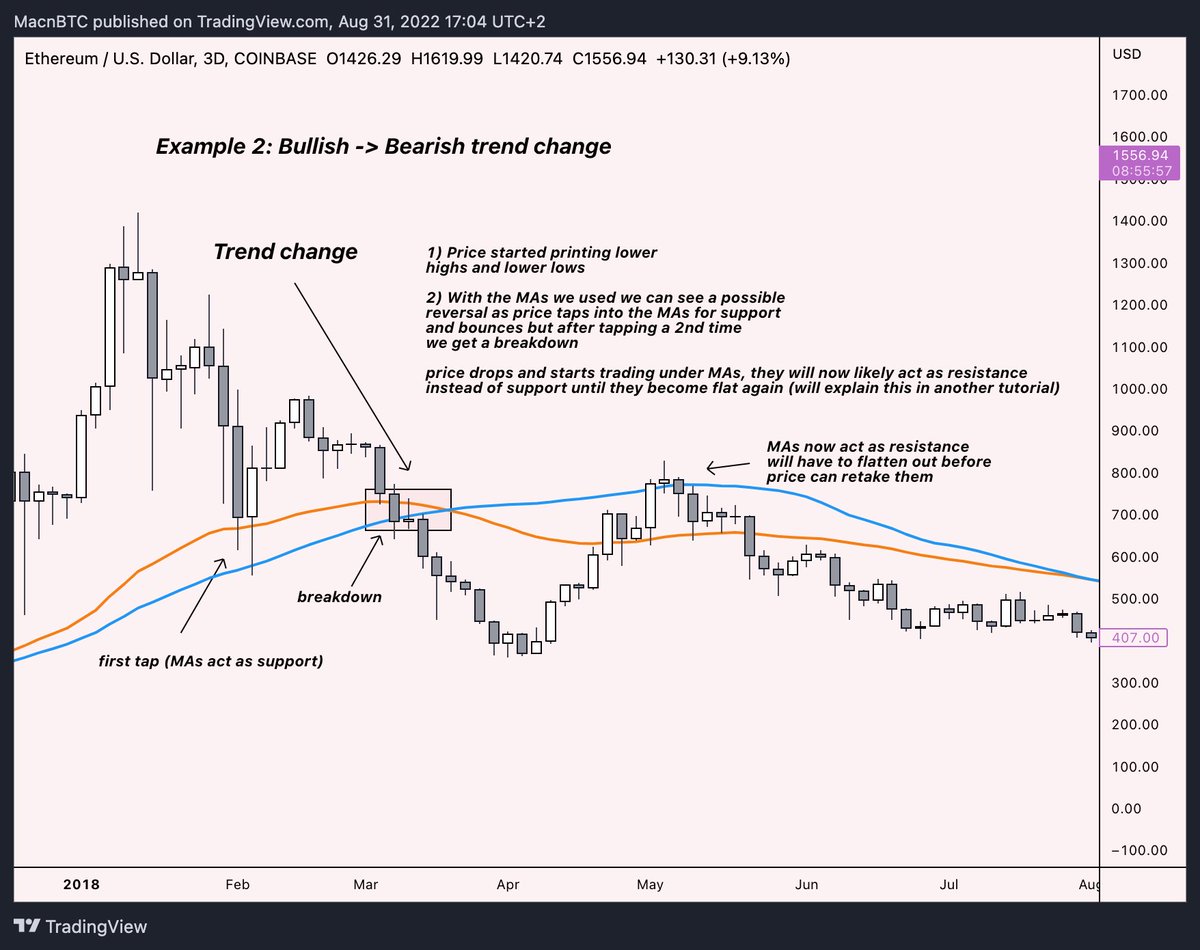
Let’s now look at a trend reversal from bullish -> bearish.
In this example we see the trend reversing from bullish to bearish.
In this example we see the trend reversing from bullish to bearish.
How do we know an asset is trending bearish?
Let’s look at this example of a bearish trend.
This is $ETH on 3D but this time I added two more MAs to demonstrate how they can give us more confirmation.
Let’s look at this example of a bearish trend.
This is $ETH on 3D but this time I added two more MAs to demonstrate how they can give us more confirmation.
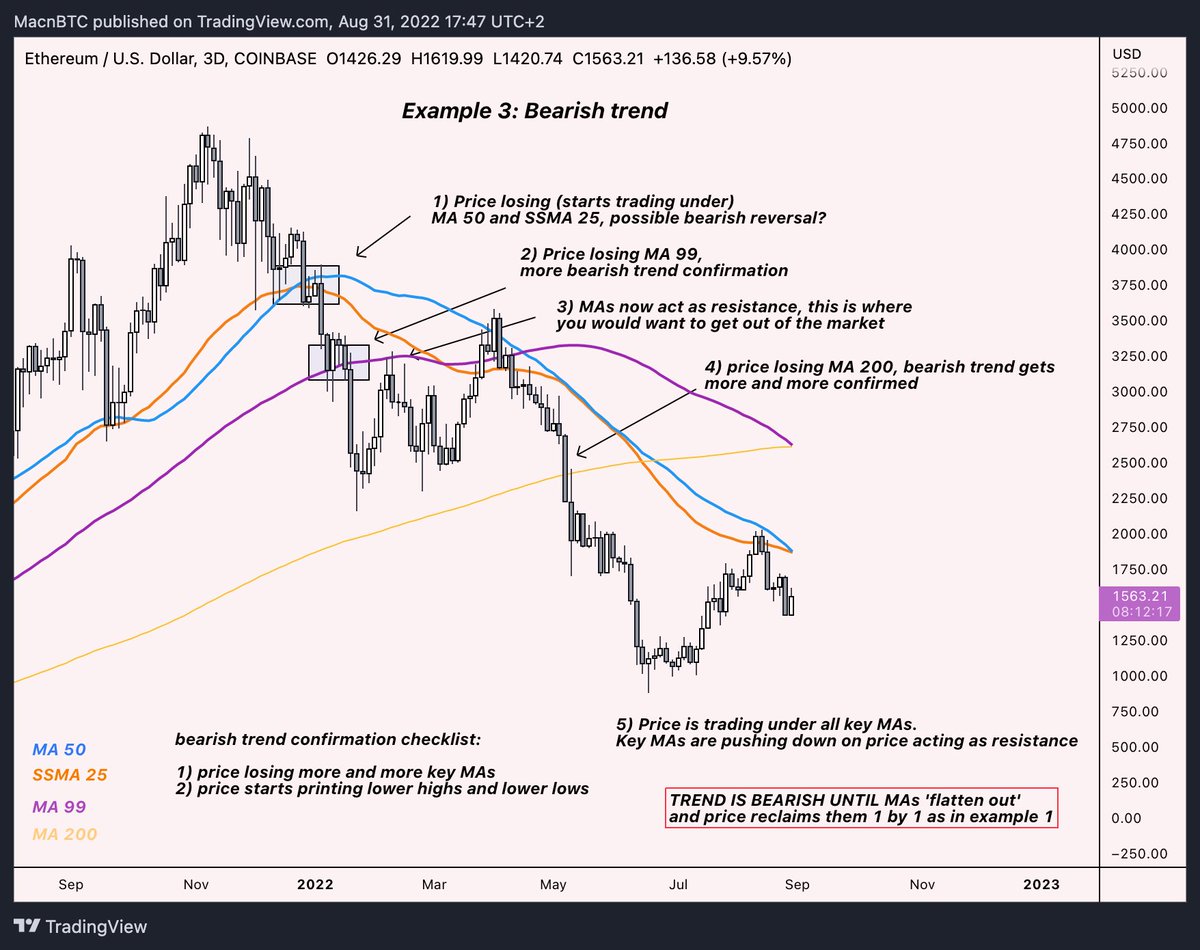
A trend is bearish if price trades under key MAs and the MAs are pushing down on price at an aggressive angle.
MAs will now have to “flatten out” before the price can reclaim them and the trend can reset. Let's see
MAs will now have to “flatten out” before the price can reclaim them and the trend can reset. Let's see
Trend reversal, bearish -> bullish
We can use MAs to identify when a bearish trend is getting closer to reversal.
We do that by studying the angle of MAs following the price. If the angle the MAs are trending in starts to become flat -> trend is getting closer to reversal.
We can use MAs to identify when a bearish trend is getting closer to reversal.
We do that by studying the angle of MAs following the price. If the angle the MAs are trending in starts to become flat -> trend is getting closer to reversal.

A trend officially reverses when MAs start to turn flat and price starts to trade over them one by one.
The more MAs price retakes and starts trading over the more confirmation of a trend change.
The more MAs price retakes and starts trading over the more confirmation of a trend change.
As you have seen, MAs can help us find out when to buy and when to wait and when to get out of the market.
But MAs are often not enough.
As you saw in the last example the market often goes sideways for months before officially bottoming and confirming a reversal.
But MAs are often not enough.
As you saw in the last example the market often goes sideways for months before officially bottoming and confirming a reversal.
We can use the knowledge we have about MAs and add another condition to our buy/sell strategy.
Condition 2: Buying at levels of interest combined with our MA strategy.
MAs give a general idea of what stage of a cycle an asset is trading in.
We can combine MAs with levels of interest (support/resistance) to improve our chances at the best possible entry prices.
MAs give a general idea of what stage of a cycle an asset is trading in.
We can combine MAs with levels of interest (support/resistance) to improve our chances at the best possible entry prices.
There are many ways of marking levels of interest.
For the past 3 years I have mostly used custom coded VWAP indicators in my strategy (tutorial for another day).
I will keep this tutorial as simple as possible and teach you how to mark key levels on a naked chart.
For the past 3 years I have mostly used custom coded VWAP indicators in my strategy (tutorial for another day).
I will keep this tutorial as simple as possible and teach you how to mark key levels on a naked chart.
How to mark out key levels of interest on a chart (part 1)
When making out levels, understand that they are not supposed to be perfect. I recommend starting out marking levels with boxes instead of lines.
$TLSA on a 1W timeframe!
When making out levels, understand that they are not supposed to be perfect. I recommend starting out marking levels with boxes instead of lines.
$TLSA on a 1W timeframe!
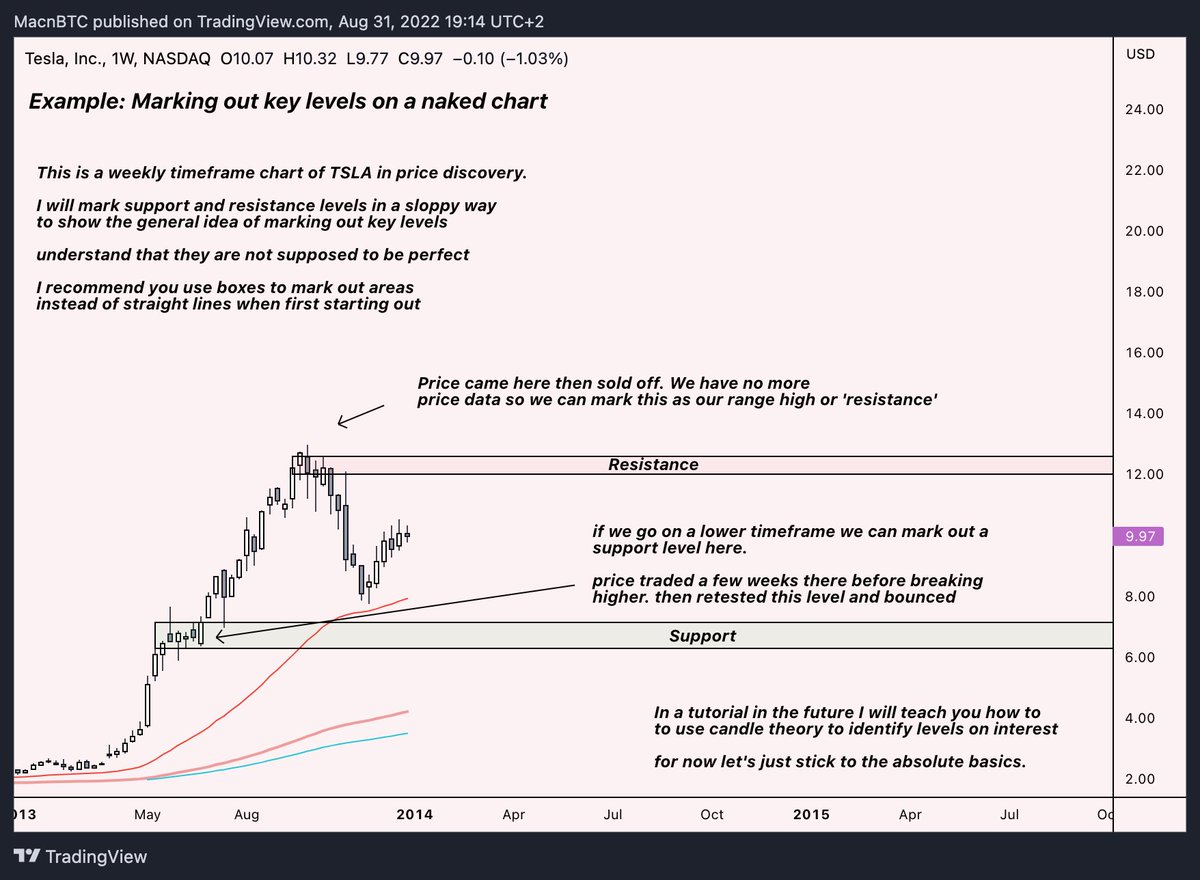
Part 2: In this example I will demonstrate how the resistance we marked out turned into support after price broke above it and how we can use it as an area of interest where we can buy.
You will also learn what to do when a support breaks.
You will also learn what to do when a support breaks.
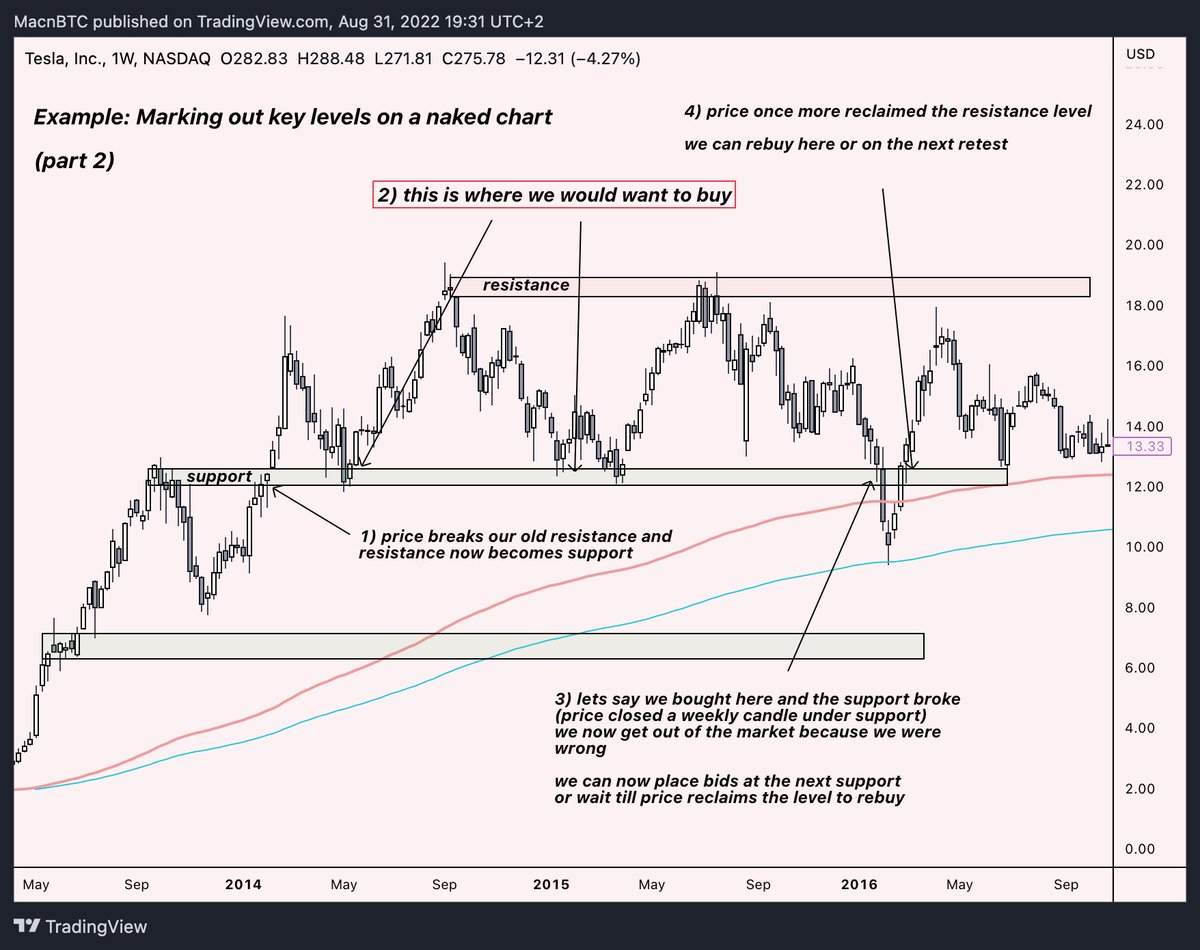
Part 3: We continue marking out new support/resistance levels.
Notice how they rotate from being support to resistance and the other way around.
Study how price consolidates under double resistance blast through them, retakes all key MAs and starts a rally ✍🏽
Notice how they rotate from being support to resistance and the other way around.
Study how price consolidates under double resistance blast through them, retakes all key MAs and starts a rally ✍🏽

Let’s look at one more example of $BTC on a high timeframe and mark key areas of support/resistance.
Sloppy quick marking of closest support/resistances on a naked 1W $BTC chart.
Sloppy quick marking of closest support/resistances on a naked 1W $BTC chart.

If we now add what we learned about MAs to this chart we can suddenly create a PLAN 🤝
• Market structure is bearish.
• I have marked out support levels and will use 10% of my fiat to buy $BTC when they get retested.
• I will then sell what I bought at resistance levels.
• Market structure is bearish.
• I have marked out support levels and will use 10% of my fiat to buy $BTC when they get retested.
• I will then sell what I bought at resistance levels.
• I will get out of the market if the support levels break as I was wrong.
•I will deploy the majority of my capital when a trend reversal is confirmed by Moving Averages.
•If a full on bullish trend is confirmed I will wait with taking profit till major resistances.
•I will deploy the majority of my capital when a trend reversal is confirmed by Moving Averages.
•If a full on bullish trend is confirmed I will wait with taking profit till major resistances.
Congratulations you have now learned the absolute Technical Analysis basics.
Hopefully you will use this knowledge to navigate the markets and earn 💸
Hopefully you will use this knowledge to navigate the markets and earn 💸
We can always add additional indicators and analysis such as sentiment/oversold/overbought to further increase our chances of being right.
There is much much more I would love to teach you. If this thread receives good feedback I will create more.
Additionally, I will consider releasing my indicators to my followers for FREE ❤️
• Retweets and shares are appreciated.
- Mac 🐺
Additionally, I will consider releasing my indicators to my followers for FREE ❤️
• Retweets and shares are appreciated.
- Mac 🐺
Feedback on this been crazy, glad it was useful.
Don't forget to follow @MacnBTC!
I see 50% of you guys retweeting and liking but not following me.
Talk soon 🤝
Don't forget to follow @MacnBTC!
I see 50% of you guys retweeting and liking but not following me.
Talk soon 🤝
• • •
Missing some Tweet in this thread? You can try to
force a refresh


