On this #LaborDay2022 I have provided some graphs and images on labor history and labor unions.
If you're teaching modern U.S. history and cover the Gilded Age, and want evidence of a "new Gilded Age," you may also find these useful. Enjoy!
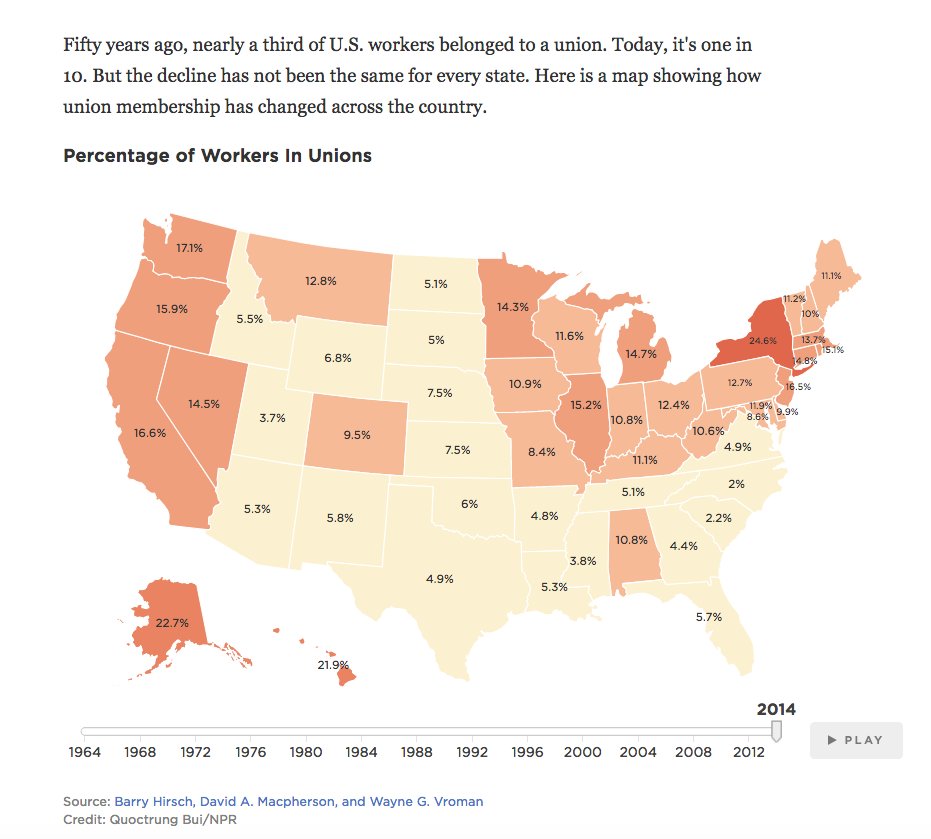
As you might expect, union membership differs among states and regions in the U.S., and also private versus public sectors.
Relative social mobility, comparing different countries, from 2017
It's impossible to talk about labor unions in the U.S. without discussing the immense power and influence of corporations, the Constitution, our anti-union (and illegitimate?) Supreme Court, dark money lobbying, and tax rates.
This is from Jonathan Levy's Ages of American Capitalism. As labor's share of income decreases, corporate profits increase.
Members of the House of Representatives are more responsive to the needs of the working class and poor in districts that have high union membership.
Very alarming stats on the pay of CEOs and how much wealth the 1% own. Thanks to @Claudia_Sahm for the graph in orange.
Don't forget that the 2017 Trump* tax cuts were outlandishly and immorally generous toward the very rich.
Remember these trends the next time someone says they don't like paying taxes or believes in tax cuts. EVERY GOP tax cut since the 1980s has delivered most of the gains to the very rich.
• • •
Missing some Tweet in this thread? You can try to
force a refresh
1. The last in my series of THREADS on Inflation and the Economy (Part 4 of 4) poses a media-centered explanation for Americans’ negative impressions of the economy and concludes with an exposition of key concepts intended to help us understand the complexities of our economy.
2. One of the best graphs that explains so much of our discourse was put together by @mcopelov. He used the database Lexis/Uni to look up stories on different topics over a 3-year period. You can see the outsized extent of inflation coverage.
3. Not only was the media covering inflation more than any other topic, but it was focusing on an inherently negative topic while an impressive economic recovery was under way. No wonder people have been so unhappy with the economy.
1. This third THREAD in my 4-part series on Inflation and the Economy analyzes the uniquely American conundrum of a gap between consumer sentiment and the macroeconomic indicators of our economy.
Here I’ll talk about the nature of the two political parties and COVID.
2. Parts 1 and 2 were fact-driven. Parts 3 and 4 will be more analytical (although of course any analysis requires facts).
3. Consumer sentiment tracked alongside macroeconomic indicators pretty well for 40 years. If the economy expanded or contracted, you’d see this movement reflected (accurately) in consumer sentiment. Then in 2020 the sentiment and indicators diverged.
1/33. Part 2 of 4 of my series of THREADs on Inflation and the Economy discusses the positive characteristics Americans should consider when they evaluate the economy.
2/33. COVID brought about three rounds of fiscal stimulus. One came with the CARES Act of March 2020. The second was passed in December 2020 and the third was part of President Biden’s American Rescue Plan in March 2021.
3/33. A typical individual could expect over $3,000 combined from these checks. According to an analysis from the Census Bureau, stimulus checks substantially reduced hardship from food shortages, financial instability, and anxiety.
1/58. Part 1 of 4 in my series of THREADs on Inflation and the Economy explores the various reasons why Americans might view the economy negatively.
2/58. What is inflation? It is the loss of purchasing power observable in rising prices and paying more money for the same amount of goods. The Bureau of Labor Statistics (BLS) calculates the inflation rate when it issues a monthly Consumer Price Index (CPI) on a basket of goods.
3/58. Inflation can occur for several reasons and there are numerous theories to explain the phenomenon. One way to think about inflation is that rising prices are a response to some sort of imbalance between supply and demand.
a) GOP voters are misinformed about the seriousness of human-caused climate change (AGW) because:
b) they take cues from GOP political & media elites who:
c) are beholden to a well financed campaign of denial & deception from fossil fuel corporations.
3/99. Let’s start with voters. There’s a partisan & regional orientation to the distribution of Americans who think climate change is mostly caused by humans. Disappointing results from parts of Appalachia, the Gr Plains, and Mtn West overlap w/regions where conserv voters live.