Mike Simonsen 🐉 Profile picture
Sep 7, 2022 6 tweets 3 min read Read on X
Available inventory of homes for sale is now declining for the season.

553,000 single family homes on the market.

Prices ticking down too.

This week's (belated!) @AltosResearch real estate market update 🧵📽️👇

1/6 Image
We'll quite obviously finish 2022 with fewer than 500,000 single family homes on the market.

Will homeowners *ever* unload their amazing investments?!

Buyers will face a pretty severe shortage again next year 😰

2/6 Image
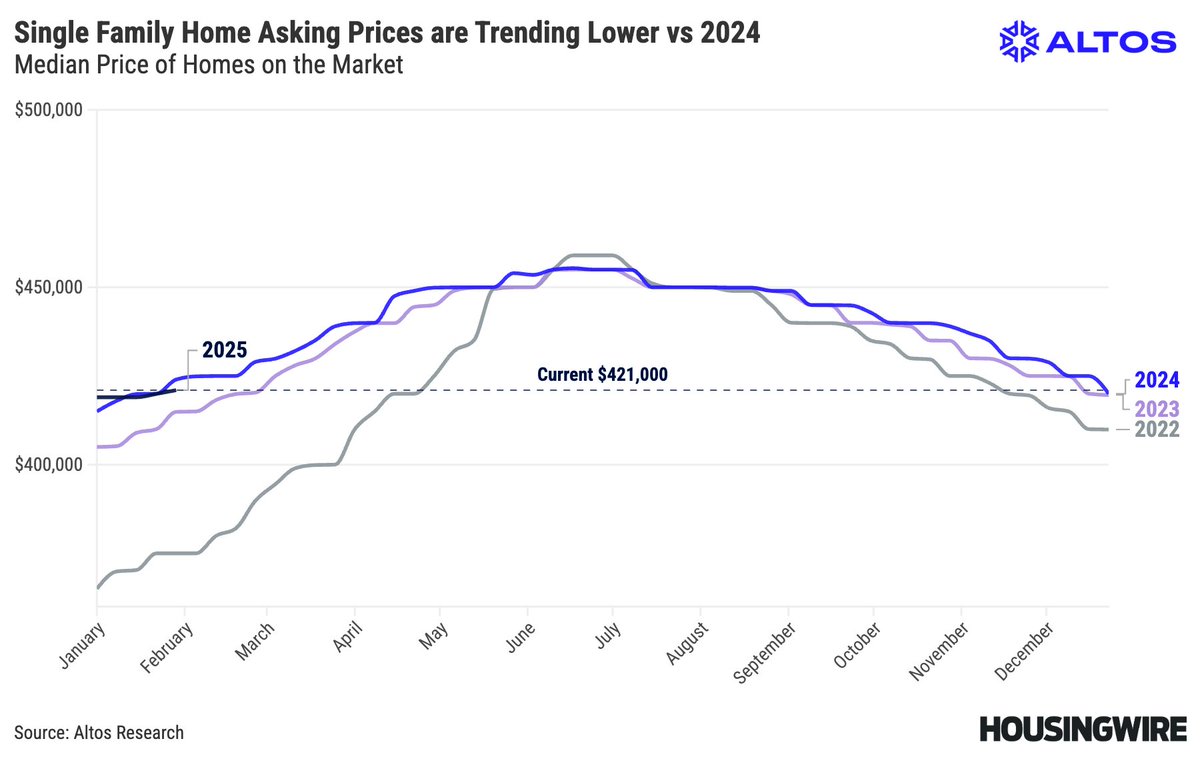
Home prices are ticking down.

Median price of single family homes in the US is $440,000 this week.

Seasonal declines in prices will continue through the end of the year.

We'll end 2022 with about 10% home price gains over 2021.

3/6 Image
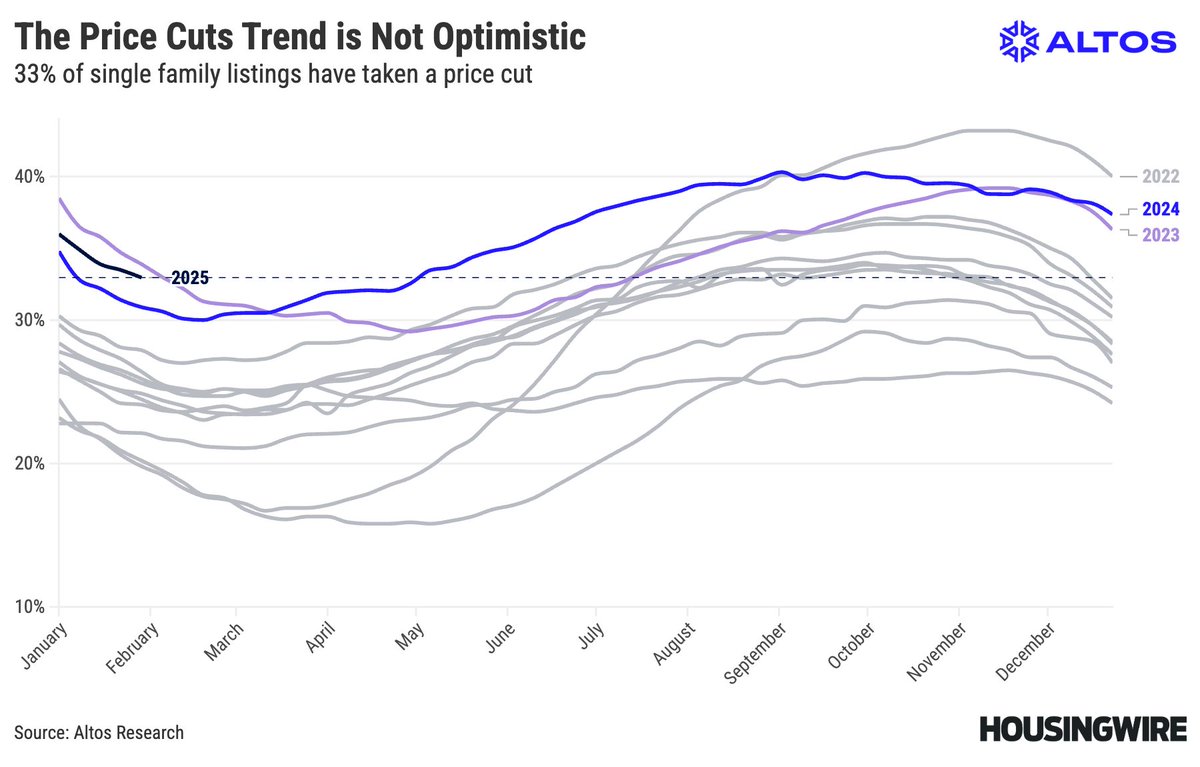
Price reductions show weakness in buyer demand.

The percent of homes that have taken a price cut from original list price climbed over 40% now.

Price reductions will keep climbing through October.

If we reach 45%, that'll be quite bearish for home prices in 2023.

4/6 Image
Our immediate sales tracker has become more useful in showing how few properties are hitting the market each week now.

It's kinda incredible how abruptly sellers hit the brakes.

It's Labor Day week so we'll have fewer still new listings in next week's data.

5/6 Image
Here's the video with the detail on how inventory of homes for sale is declining.

What a surprise from even just a few weeks ago.

We'll end the year with fewer than 500k homes on the market. Wild.


6/6

• • •

Missing some Tweet in this thread? You can try to force a refresh
 

Keep Current with Mike Simonsen 🐉

Mike Simonsen 🐉 Profile picture

Stay in touch and get notified when new unrolls are available from this author!

Read all threads

This Thread may be Removed Anytime!

PDF

Twitter may remove this content at anytime! Save it as PDF for later use!

Try unrolling a thread yourself!

how to unroll video
  1. Follow @ThreadReaderApp to mention us!

  2. From a Twitter thread mention us with a keyword "unroll"
@threadreaderapp unroll

Practice here first or read more on our help page!

More from @mikesimonsen

May 6
This week’s housing thread! Here's the summary from this week’s @AltosResearch video.

[video link follows the thread]

As inventory continues to climb, the leading indicators for future home sales prices are weakening.

Even as the headlines now show 5-7% price growth over 2023, the latest data points to flat growth in home prices for the full year 2024.

Details 👇

1/7
Inventory

📍600,000 single family homes are unsold on the market
📍That’s up 0.6% from last week and 33% more than a year ago
📍In 2022 inventory was climbing much more quickly than now, so that gap is down to 83%
📍In the Inventory chart below you can see the gains compared to last year’s curve and also to two years ago.
📍Inventory has plenty more to grow this year. This trend is not slowing down.

2/7Image
New Listings
📍71,000 new listings unsold this week. That’s slightly fewer than last week but still generally rising.
📍Plus another 22,000 new listings already in contract - immediate sales
📍93,000 new listings is 20% more sellers than last year.
📍Even with the big gains in the South, there are still 20% fewer sellers than in “normal” years, pre-pandemic. In 2022, there were 105,000 new listings the first week of May.
📍And that’s why we see this as growth in sellers, but not a worrisome flood. In the New Listings chart below, the gray lines show how there are still not a lot of sellers currently.

3/7Image
Read 7 tweets
Mar 18
The Fed meets this week and the market is growing less sanguine about interest rate cuts.

What happens to the housing market if mortgage rates actually go up from here?

Inventory is growing and will continue to grow. Are there risks that supply and demand grow out of balance?

I don’t have ability to forecast mortgage rates, but we do know exactly how the housing market will behave if rates jump or fall from here. That’s what we’re discussing in this week’s Altos Research real estate market video.

[Video link follows the thread]

1/7
Inventory
📍507,000 single family homes are on the market in the US
📍That’s 1.3% more than last week, 22% more than a year ago, and 105% more than two years ago.
📍This week in 2022 was the last of the 3% mortgages. Inventory and rates rose in lockstep starting then. In the Inventory chart below see the rightmost red section that highlights the last two years of rising rates and rising inventory.
📍In the next quarter if rates finally fall, say to the mid-6s, this inventory expansion trend will reverse.

2/7Image
New Listings
📍There were 59,000 new listings adding to inventory this week, with another 16,000 immediate sales, total new sellers were 24% more than in 2023.
📍In the New Listings chart below, you can see this week’s growth is a bit of an anomaly, we won’t see that much growth next week.
📍You can also see the gray lines showing previous years with 70-80,000 new listings in mid-March. So there are still not a lot of sellers.
📍We expect this trend of slightly more sellers to continue for the bulk of 2024.

3/7Image
Read 7 tweets
Feb 26
Monday @AltosResearch real estate data thread!

More sellers, fewer buyers.

Mortgage rates hit 7.2% last week.

Inventory of unsold homes subsequently increased this week for the first time all year.

Price reductions ticked up too for the first time since November.

Some of the home price signals are softening as potential home buyers are faced with higher for longer mortgage rates.

These are the details we’re reviewing in this week’s housing market data video.

[video link follows the thread]

1/7
Inventory

📍There are now 498,000 single family homes on the market in the US.
📍That’s almost 1% more than last week, and now 16% more than last year at this time.
📍This is the first inventory increase of the year.
📍Mortgage rates are up sharply from last year so inventory is too
📍In the Inventory chart below, the red periods are when rates and inventory were rising. The green sections are when rates and inventory were falling.

2/7Image
Pending Home Sales

📍This week saw 59,000 new contracts for single family homes, that’s 2% fewer than last week
📍The sales rate came in a fraction fewer than a year ago, which is what I projected last week but still disappointing
📍In the New Contracts Pending chart below you can see how sales could come in negative YoY in the next few weeks.
📍I still expect home sales to show year over year growth again by mid-March, due to the fact that there is more selection available now.

3/7Image
Read 7 tweets
Feb 19
Monday housing thread!

With mortgage rates now back in the 7s, demand is slowing and it seems like some home price signals are softening.

We have more sellers entering the market than last year at this time. We can see mortgage rates slow demand. And as demand slows, inventory grows.

More supply should lead to more home sales in 2024. And sales have indeed been slowly rising, but this has unreliable week to week. It’ll be important to keep our eyes on the pending sales rate to know if supply is outpacing demand.

These are the details we’re reviewing in this week’s Altos Research real estate market data.

[video link follows the thread]

1/7
New Listings

📍There were 63,000 new listings this week, of which 13,000 are already in contract which leaves 50,000 new listings adding to inventory.
📍That’s 16% more sellers than last year at this time. This is the same trend we’ve been reporting for a few months and a big reversal from last year.
📍While sellers are finally coming back from 2023’s anemic market, it’s still not a lot of sellers.
📍In the New Listings chart below, the gray lines are previous years. See this year climbing, but a lot fewer sellers than pre-pandemic seasons.

2/7Image
Inventory

📍There are now 495,000 single family homes on the market in the US.
📍That’s 0.1% fewer than last week, but now 13% more than last year at this time.
📍In the Gulf markets, including SW Florida, New Orleans, and over to Texas, inventory is back above 2019 levels.
📍In the West and much of the Northeast, inventory is still below last year, but the gap is closing pretty much everywhere across the country.
📍In the Inventory chart below, you can see how the year’s curve is growing compared to last year, even though the available supply ticked down this week.

3/7Image
Read 7 tweets
Jul 24, 2023
Will existing home sales break above 4.2 million? Fall below 4 million?

That's what we're looking at in this week's @AltosResearch market video.

We dive into the weekly pending sales as well as inventory and prices.

Video links below 🧵📽️👇

1/8
There are 378k single family homes in contract.

These are homes that will sell in July, August, September when the transaction closes.

In the weekly data you can see that the pace of sales is holding up, where last year at this time it had started falling quickly

2/8 Image
📍Each week we're seeing 80-90k new contracts (including single family + condos)

📍Translates to 4.2 million annually.

Look how quickly sales stalled last year. They're stable this year.

What we can see now is that the sales rate is NOT increasing. But not falling either.

3/8 Image
Read 8 tweets
Jun 19, 2023
Are 7% mortgage rates finally impacting home buyer demand?

I explore some of the signals in today's @AltosResearch market video. Details 👇

📍Inventory of single family homes for sale is inching up. 451,000. Still supply constrained. Only 7% more homes on the market vs '22

1/6 Image
We always look for demand signals in the price reductions data. And maaaybe some early signs that fewer homes are getting their offers.

📍31.4% of homes on the market have taken a price cut.
📍Price cuts accelerated just a touch more than expected this week.

2/6 Image
Home prices are at their peak for the year.

📍The median price of single family homes is now $455,000.
📍That's 1% below last year at this time.
📍Prices have momentum from buyers earlier in the year still.

3/6 Image
Read 6 tweets

Did Thread Reader help you today?

Support us! We are indie developers!


This site is made by just two indie developers on a laptop doing marketing, support and development! Read more about the story.

Become a Premium Member ($3/month or $30/year) and get exclusive features!

Become Premium

Don't want to be a Premium member but still want to support us?

Make a small donation by buying us coffee ($5) or help with server cost ($10)

Donate via Paypal

Or Donate anonymously using crypto!

Ethereum

0xfe58350B80634f60Fa6Dc149a72b4DFbc17D341E copy

Bitcoin

3ATGMxNzCUFzxpMCHL5sWSt4DVtS8UqXpi copy

Thank you for your support!

Follow Us!

:(