Power analysis for #interactions can be tough!
📢 Our new preprint features:
𝟭 An intuitive taxonomy of 12 types of interaction
...with the 𝘕s to reach power = .80/.90
𝟮 A 😭 meta-study
𝟯 Simulations testing 3 ways to ↗️ power
𝟰 A cool web app!
🧵
osf.io/xhe3u/
📢 Our new preprint features:
𝟭 An intuitive taxonomy of 12 types of interaction
...with the 𝘕s to reach power = .80/.90
𝟮 A 😭 meta-study
𝟯 Simulations testing 3 ways to ↗️ power
𝟰 A cool web app!
🧵
osf.io/xhe3u/
𝟭𝗮 As we know from popular blogs/papers, power analyses differ b/w main effects & interactions because:
👉a main effect corresponds to a difference b/w means
👉a two-way interaction corresponds to a difference b/w mean subdifferences
(using simple b/w-Ss designs as examples)
👉a main effect corresponds to a difference b/w means
👉a two-way interaction corresponds to a difference b/w mean subdifferences
(using simple b/w-Ss designs as examples)

𝟭𝗯 Thus, when running a power analysis…
✅ It is OK to use a generic value to define the expected effect size of a main effect (e.g., a medium-sized difference of 𝘥 = 0.35)
❌ But it is NOT OK to use a generic value to define the expected effect size of an interaction
✅ It is OK to use a generic value to define the expected effect size of a main effect (e.g., a medium-sized difference of 𝘥 = 0.35)
❌ But it is NOT OK to use a generic value to define the expected effect size of an interaction

𝟭𝗰 To determine the type of interaction you expect, we argue that you must answer two Qs:
𝗤𝟭 What is the expected shape of my interaction?
➡️Reversed? Fully attenuated? Partially attenuated?
𝗤𝟮 What are the expected sizes of my simple slopes?
➡️Small? Medium? Large?
𝗤𝟭 What is the expected shape of my interaction?
➡️Reversed? Fully attenuated? Partially attenuated?
𝗤𝟮 What are the expected sizes of my simple slopes?
➡️Small? Medium? Large?

𝟭𝗱 This results in 12 basic types of interactions.
👇 see Table 👇
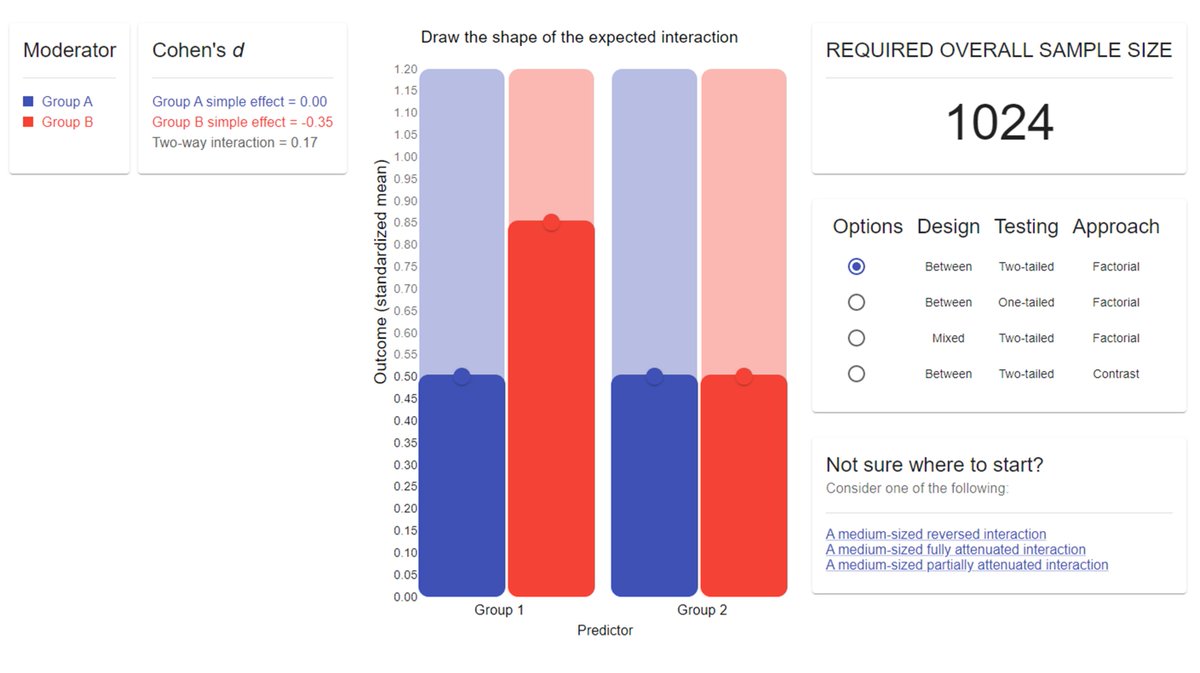
E.g., a “0.35 | 0.00 fully attenuated interaction” (in red) involves a medium-sized simple slope & a null simple slope. If such an interaction is true, 𝘕 = 1,024 will give you an 80% probability to detect it.
👇 see Table 👇
E.g., a “0.35 | 0.00 fully attenuated interaction” (in red) involves a medium-sized simple slope & a null simple slope. If such an interaction is true, 𝘕 = 1,024 will give you an 80% probability to detect it.

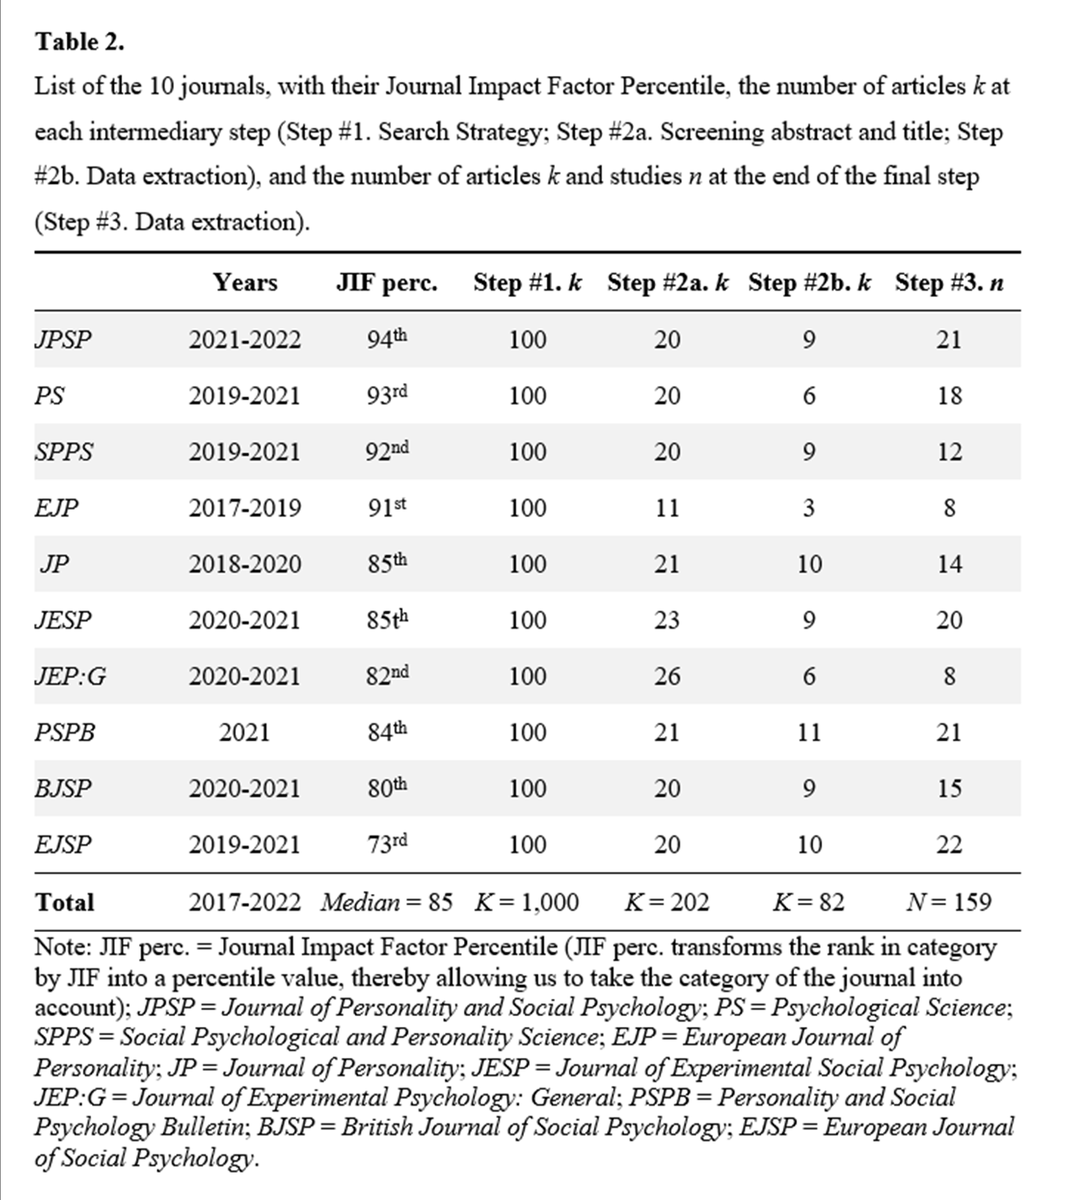
𝟮𝗮 From there, we wanted to know how researchers handle power analysis when having an interaction hypothesis.
We ran a prereg meta-study & built a sample of 159 studies testing interactions published 10 influential psychology journals.
Three (kinda depressing) conclusions.
We ran a prereg meta-study & built a sample of 159 studies testing interactions published 10 influential psychology journals.
Three (kinda depressing) conclusions.


𝟮𝗯 Conclusions #1 🙁
The majority of the studies in the lit test partially attenuated interactions (the most difficult to detect)
The majority of the studies in the lit test partially attenuated interactions (the most difficult to detect)

𝟮𝗰 Conclusions #2 ☹️
Less than 5% of the studies report an adequate power analysis (many use an inadequate generic value to define the expected effect size of the interaction)
Less than 5% of the studies report an adequate power analysis (many use an inadequate generic value to define the expected effect size of the interaction)

𝟮𝗱 Conclusions #3😢
The overall median power to detect a medium-sized interaction of a given shape is .18.
The overall median power to detect a medium-sized interaction of a given shape is .18.

𝟯𝗮 From there, we wanted to find solutions to the problem of power when testing interactions.
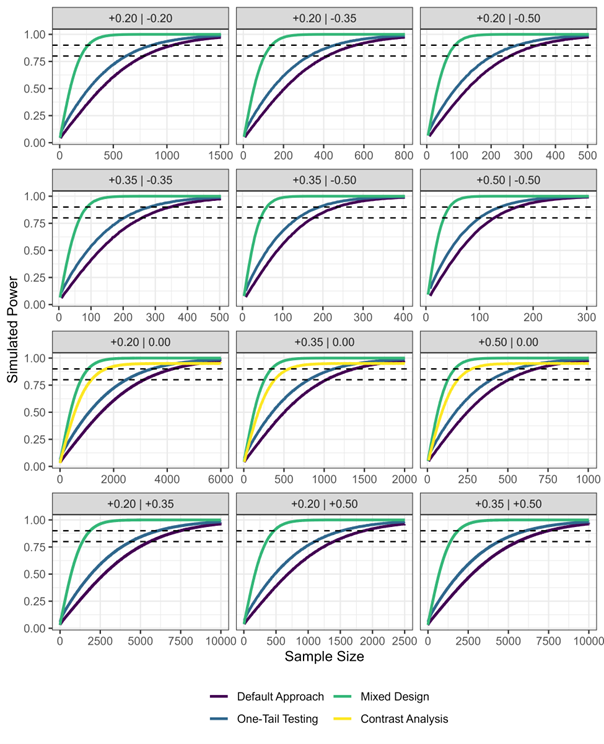
We ran zillions of simulations to generate power curves for our 12 types of interaction & tested ways to increase power without increasing 𝘕.
Three (rather comforting) strategies.
We ran zillions of simulations to generate power curves for our 12 types of interaction & tested ways to increase power without increasing 𝘕.
Three (rather comforting) strategies.

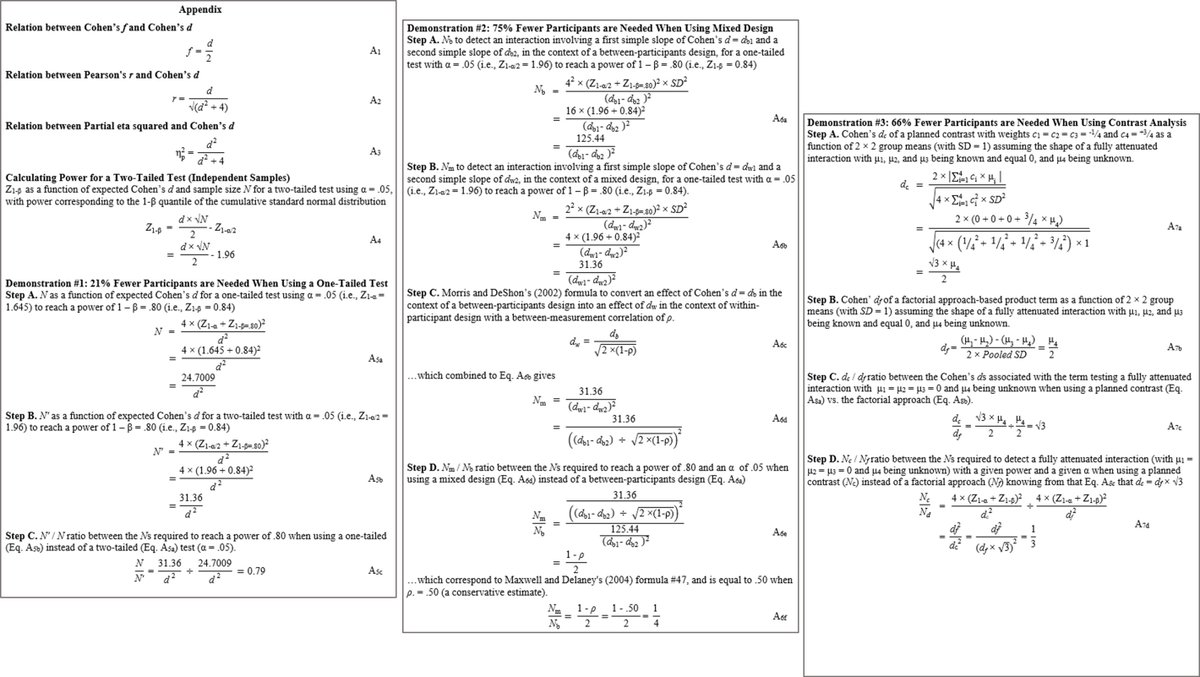
𝟯𝗯 Strategy #1 🙂
🟦If preregistering a one-tailed test (rather than using a two-tailed test), 21% fewer participants are needed to reach a power of .80 (blue curves)
🟦If preregistering a one-tailed test (rather than using a two-tailed test), 21% fewer participants are needed to reach a power of .80 (blue curves)

𝟯𝗰 Strategy #2 😀
🟩If using a mixed design* (rather than a between-participant design), 75% fewer participants are needed to reach a power of .80 (green curves)
*assuming a conservative between-measurements correlation of ρ = .50
🟩If using a mixed design* (rather than a between-participant design), 75% fewer participants are needed to reach a power of .80 (green curves)
*assuming a conservative between-measurements correlation of ρ = .50

𝟯𝗱 Strategy #3 😃
🟨 If using a planned contrast analysis* (rather than the orthodox factorial approach), 60% fewer participants are needed to reach a power of .80 (yellow curves)
*only applies to fully attenuated interactions
🟨 If using a planned contrast analysis* (rather than the orthodox factorial approach), 60% fewer participants are needed to reach a power of .80 (yellow curves)
*only applies to fully attenuated interactions
𝟰 Finally, we developed INT×Power, a user-friendly web application that enables researchers to draw their interaction & determine the sample size needed to reach a power of .80 with & without using these three strategies.
The beta version of the app:
👉intxpower.com
The beta version of the app:
👉intxpower.com
THANKS for reading this long thread
The preprint (osf.io/xhe3u/) is not submitted yet, so comments, suggestions, & criticisms are welcome and will be considered (feel free to email me).
I mean, let's be honest, there's probably at least ONE mistake in this appendix 🙃
The preprint (osf.io/xhe3u/) is not submitted yet, so comments, suggestions, & criticisms are welcome and will be considered (feel free to email me).
I mean, let's be honest, there's probably at least ONE mistake in this appendix 🙃
• • •
Missing some Tweet in this thread? You can try to
force a refresh