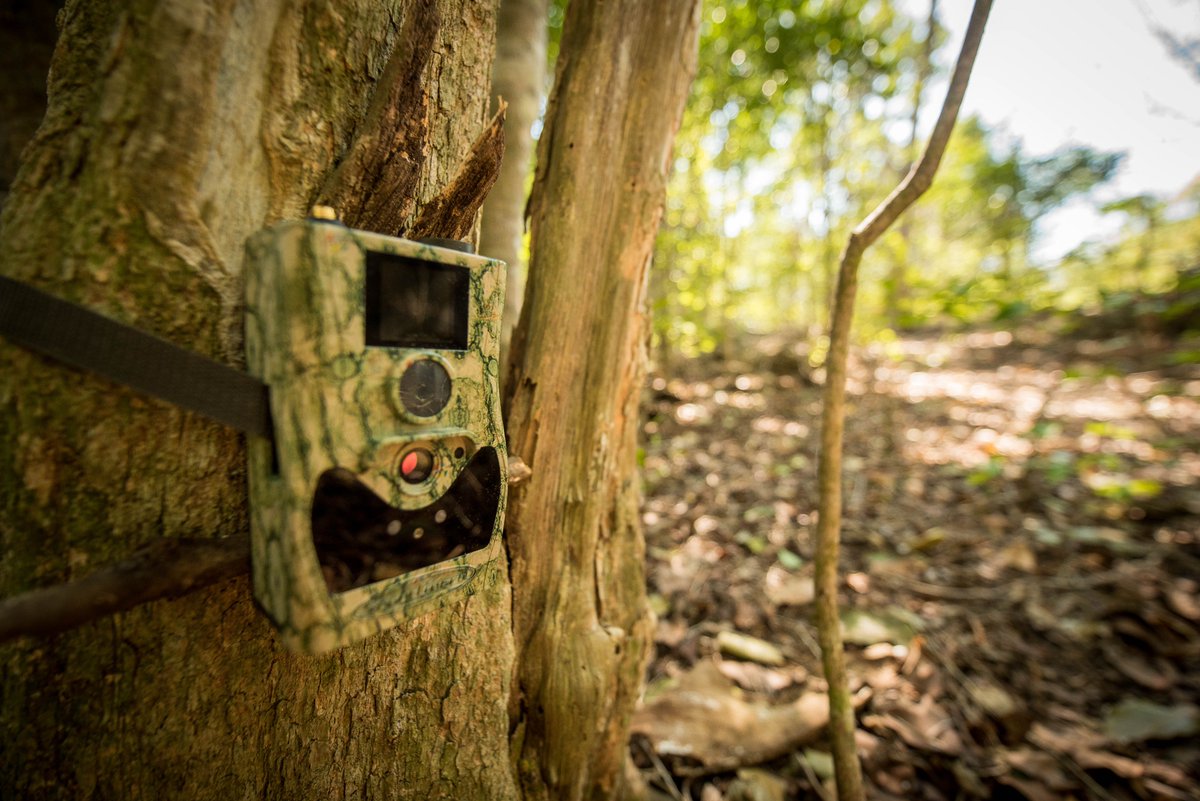
Density is the gold standard of #cameratrap monitoring. But it’s famously hard to estimate, & has only been done before 1 species at a time.
We developed a multi-species Random Encounter Model (REM) to allow density estimation for a species community 🧵
besjournals.onlinelibrary.wiley.com/doi/abs/10.111…
We developed a multi-species Random Encounter Model (REM) to allow density estimation for a species community 🧵
besjournals.onlinelibrary.wiley.com/doi/abs/10.111…
Why is this useful?
Managers, conservationists and, of course, community ecologists are often interested in multiple species at once. E.g. because they’d like to know the density of both predator & prey. Or simply for a more holistic understanding of the status of biodiversity.
Managers, conservationists and, of course, community ecologists are often interested in multiple species at once. E.g. because they’d like to know the density of both predator & prey. Or simply for a more holistic understanding of the status of biodiversity.
Typical methods for density estimation, based on capture-recapture (CR), are reliant on distinctive markings 🐅🐆🦓. But most species are 'unmarked' - they cannot be individually ID’d 🦌🐗🦘🐃🦨🐿️🐇🐪🐐🐎. So we know we can't do multi-species density estimation using CR.
There's recently been a flurry of #cameratrap papers presenting new methods to get density for unmarked species.
These share many assumptions & aspects of their statistics. We chose to extend REM to the multi-species case because IMO (🤷♂️) it's the most promising in practice.
These share many assumptions & aspects of their statistics. We chose to extend REM to the multi-species case because IMO (🤷♂️) it's the most promising in practice.
So how did we extend REM to multiple species? In short: using Bayesian inference & MCMC, bypassing the need for us to derive the likelihood mathematically.
Think of this multi-species REM as analogous to the multi-species occupancy models which have become common in recent yrs.
Think of this multi-species REM as analogous to the multi-species occupancy models which have become common in recent yrs.
We applied the model to a dataset from Borneo we had lying around gathering dust (my PhD data 🥲).
35 species in total, ranging from the smelly moonrat, through the slinking clouded leopard, to the intimidating (when you bump into them accidentally) banteng. Here's 8 others:
35 species in total, ranging from the smelly moonrat, through the slinking clouded leopard, to the intimidating (when you bump into them accidentally) banteng. Here's 8 others:

For REM, you need estimates of some pretty exotic parameters e.g. movement speed 💨 and % time animals spend active⏳. Previous REM studies have often taken estimates from the literature. Dubious practice IMO.
Instead, we estimated all parameters from the camera data directly.
Instead, we estimated all parameters from the camera data directly.
To do that, we ‘calibrated’ our camera traps just before taking them down.
This involved what we call the ‘pole dance’ method. Less thongs and glitter, though, and more sweat, mud and leeches. Basically, you take pictures of yourself holding a 1 m pole.
This involved what we call the ‘pole dance’ method. Less thongs and glitter, though, and more sweat, mud and leeches. Basically, you take pictures of yourself holding a 1 m pole.
...yes that's me 10 years ago (😳). I haven't aged a day. Moving on swiftly...
In the lab, we digitised the pole locations. These were then used with the well-described 'pinhole camera' model to relate each x,y pixel position in the image to a distance and angle from the camera.
In the lab, we digitised the pole locations. These were then used with the well-described 'pinhole camera' model to relate each x,y pixel position in the image to a distance and angle from the camera.
We also digitised the animal captures in the lab. This involved lots of clicking on images 😅. We didn't need to do all captures, though - just a representative sample. An example:
OK, phew. With that done, we enjoyed glorious animations, showing exactly where our animals walked when in front of our #cameratraps. From this, we could estimate key parameters needed for REM:
☑️size of the detection zone📷 (using distance sampling)
☑️movement speed💨
☑️size of the detection zone📷 (using distance sampling)
☑️movement speed💨
“Show me some results already!” Yeah, I hear you in the back.
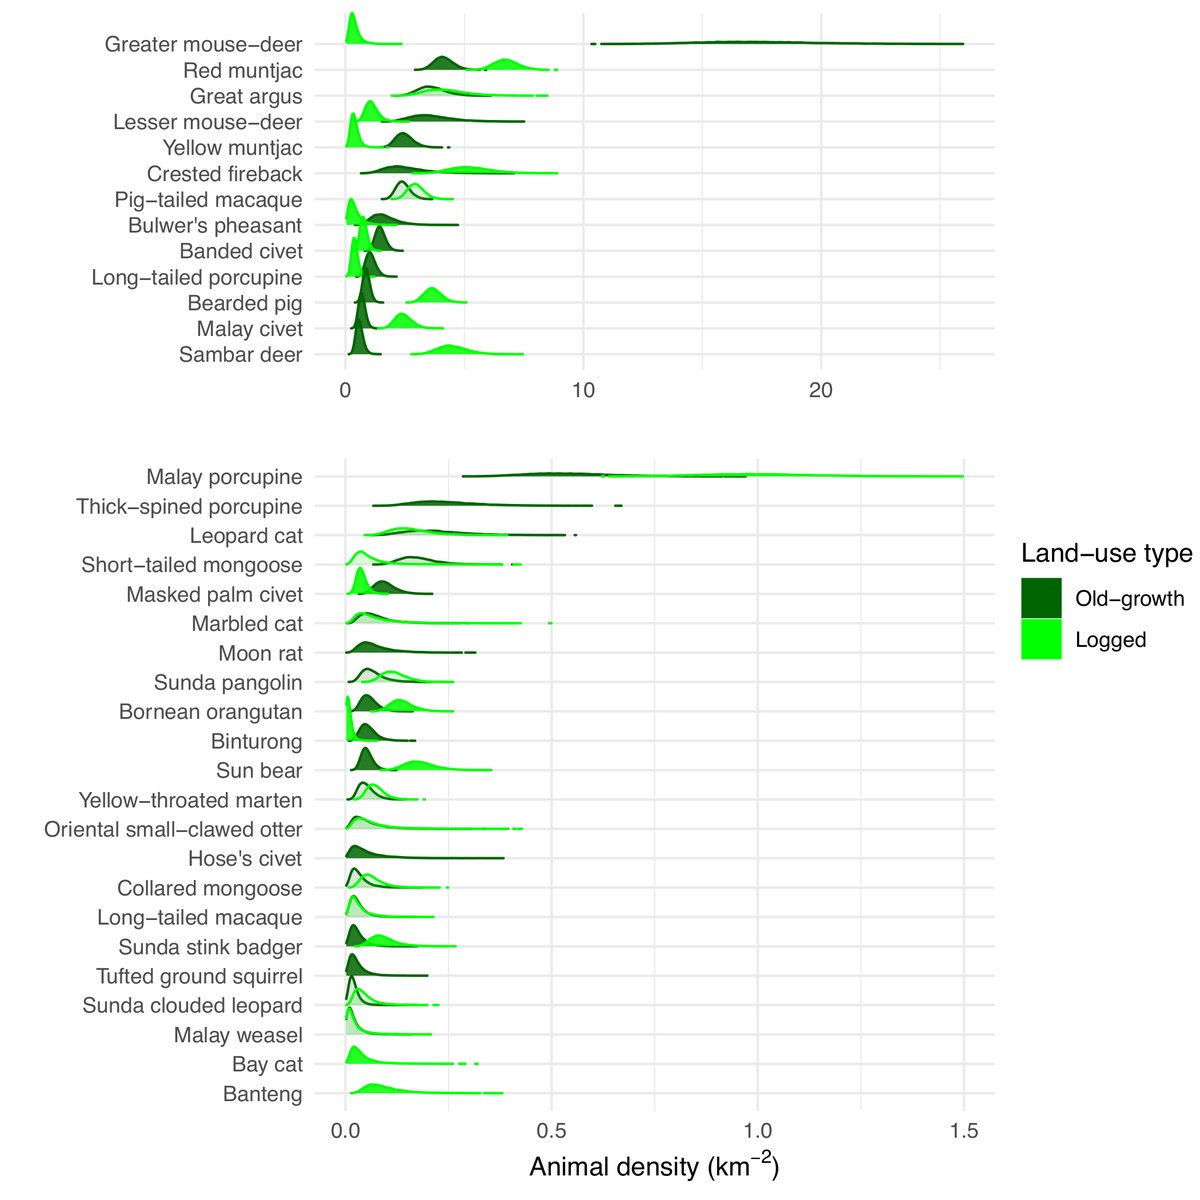
Here’s density. All are plausible from our field experience & more importantly they are within the range of density estimates previously reported. That’s not the same as proper validation, though. So exercise caution.
Here’s density. All are plausible from our field experience & more importantly they are within the range of density estimates previously reported. That’s not the same as proper validation, though. So exercise caution.

Here's 'day-range' (km walked per day). We found that animals were moving less in logged forest compared to old-growth forest.
This is at least in line with the idea that resource availability is higher in logged forest, so species are having to move less.
This is at least in line with the idea that resource availability is higher in logged forest, so species are having to move less.

We also confirmed something which is obvious to camera-trappers: detection zones vary a lot by species. Specifically, according to body size. Large species can be detected at wider angles and further distances.⚠️Be wary of any #cameratrap analysis which does NOT account for this! 

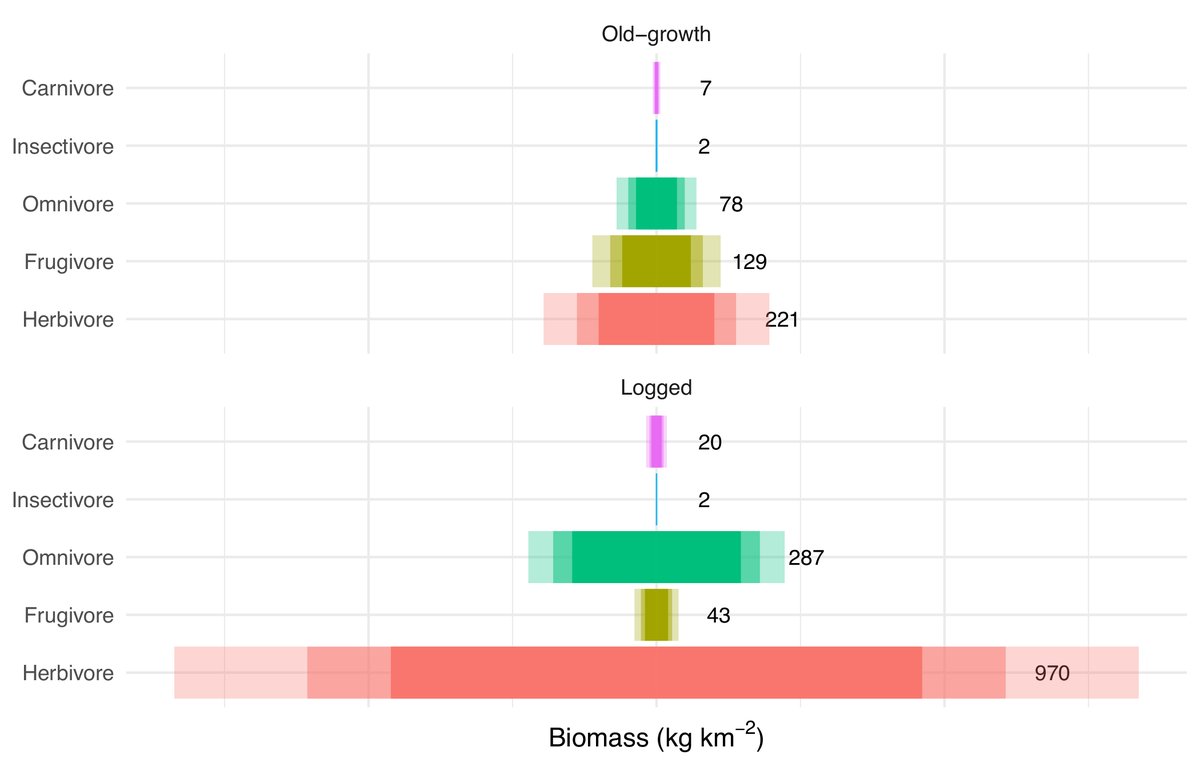
Finally, we summarised the broad trophic differences across old-growth and logged forests using a (kind of) trophic pyramid. Because, well, we could.
The broad results are consistent with the literature in terms of who wins (🍃vores!) and loses (🍒vores!) in logged forests.
The broad results are consistent with the literature in terms of who wins (🍃vores!) and loses (🍒vores!) in logged forests.

Given that it was impossible to validate our density estimates, it would be remiss of me not to point out that they should be used with appropriate caution⚠️.
In particular, we suspect that, for a few of the most arboreal species (🦧), we substantially under-estimated density.
In particular, we suspect that, for a few of the most arboreal species (🦧), we substantially under-estimated density.
Like all models, REM gives approximately 'wrong' answers, but nonetheless useful ones if assumptions are met.
IMO, REM has had an unnecessarily rough time in the literature, due in part to its misuse (more shade!) and an early misunderstanding of its assumptions.
IMO, REM has had an unnecessarily rough time in the literature, due in part to its misuse (more shade!) and an early misunderstanding of its assumptions.
If this thread hasn't completely put you off REM, and you want to get started for your own species / study / community, then there are 2 things you need to do right now:
1⃣ Deploy your cameras randomly🎲(i.e. not on trails)
2⃣ Calibrate your camera locations ('pole dance'🕺💃)
1⃣ Deploy your cameras randomly🎲(i.e. not on trails)
2⃣ Calibrate your camera locations ('pole dance'🕺💃)
Thanks to my fellow authors for their hard work on this long, long, long road. I think 7 years all told. Including (on Twitter) @thereal_jayhay, @ThorleyJack, @adambolitho_, @RealThomasBell and @MarcusRowcliffe. 🙏🙏
The article is currently paywalled (sorry 😳), but will go Open Access from January. For a pdf in the meantime, you can:
- DM me 💬
- mail me (oliver *dot* wearn *at* gmail *dot* com) 📩
- request on ResearchGate researchgate.net/publication/36…
- DM me 💬
- mail me (oliver *dot* wearn *at* gmail *dot* com) 📩
- request on ResearchGate researchgate.net/publication/36…
• • •
Missing some Tweet in this thread? You can try to
force a refresh


