Ed Clissold Profile picture
Sep 12 5 tweets 2 min read
Going thru charts, these 5 stood out:
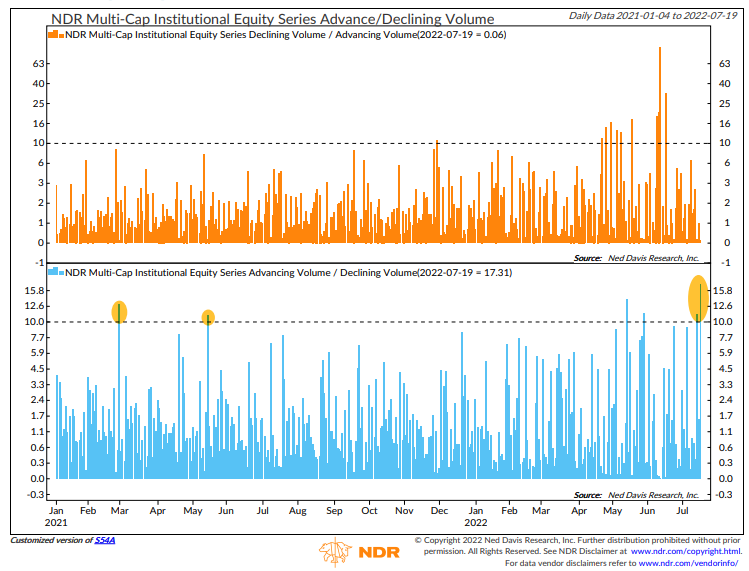
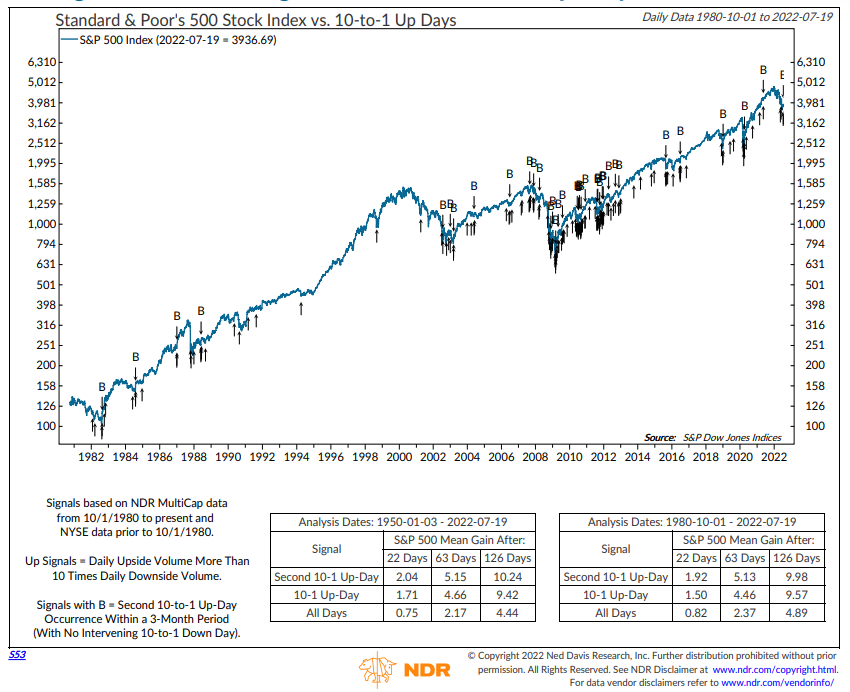
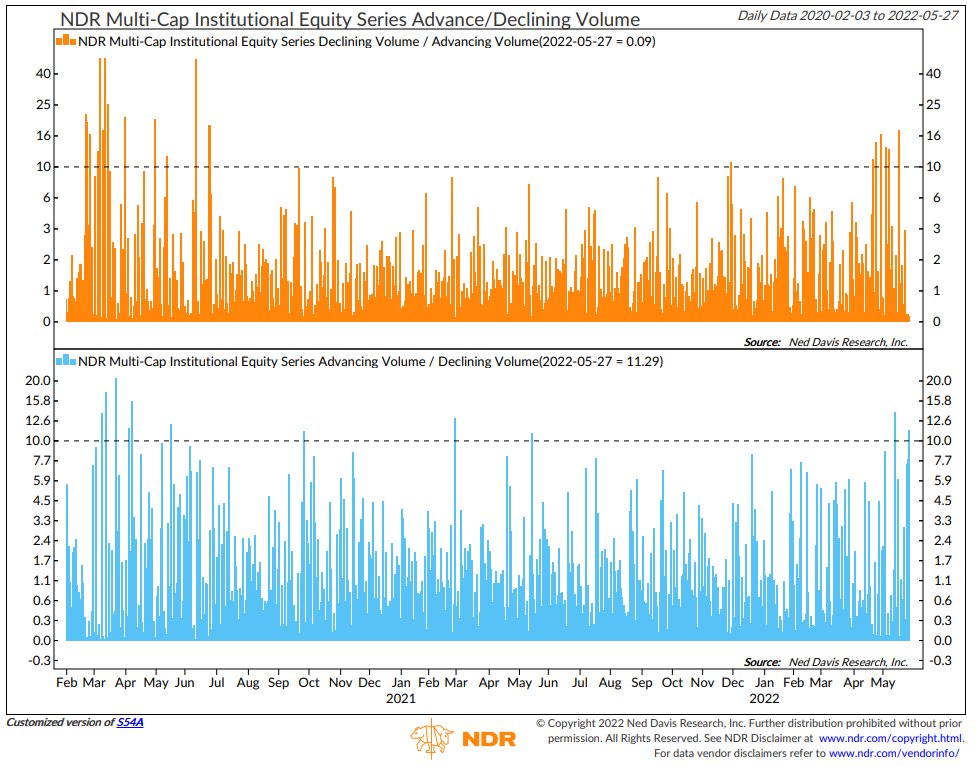
1. Friday was a 12:1 up day (advancing volume/declining volume) based on NDR Multi-Cap universe. For a double 10:1 up day, we need another 10:1 day because the Aug 10 10:1 up day was negated by the Aug 22 10:1 down day. @NDR_Research 1/5
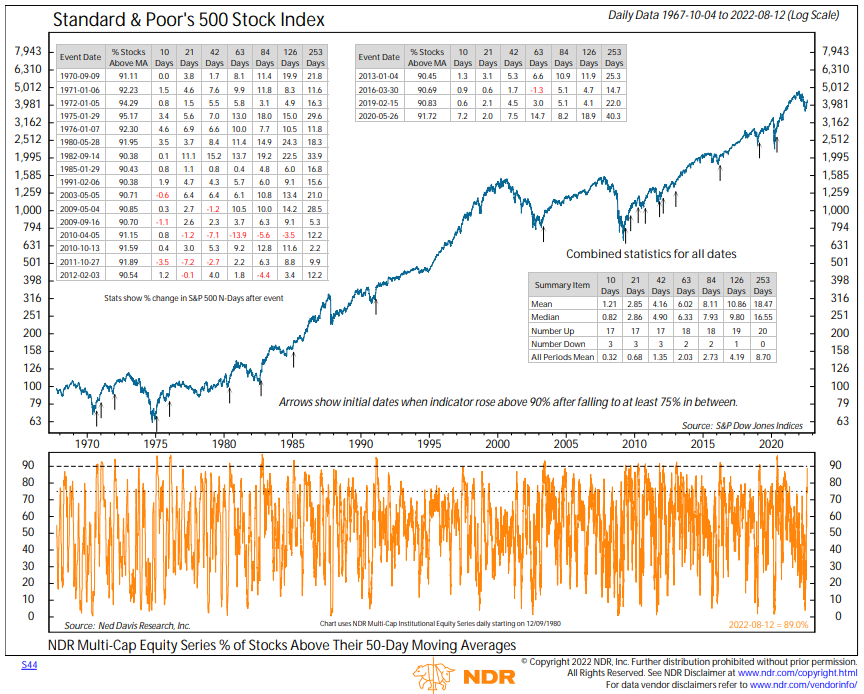
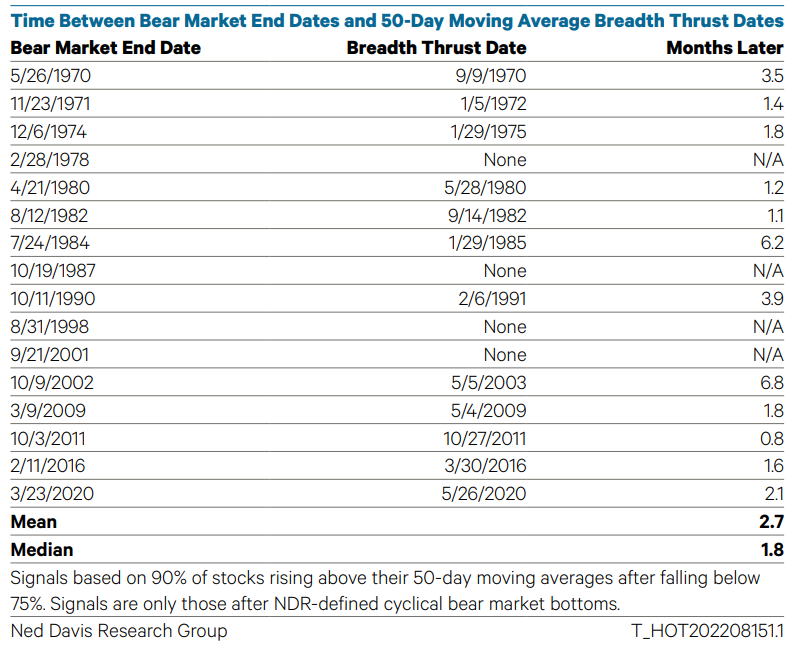
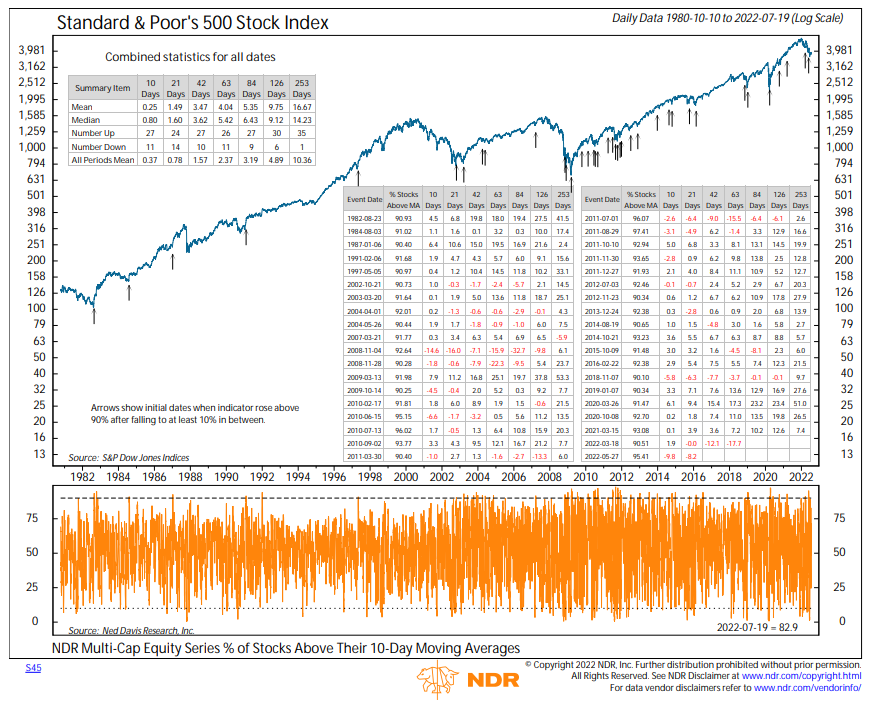
2. The % stocks >10-day moving averages jumped from 6% on Tues to 86% on Fri. Has to climb above 90% to trigger a breadth thrust. 2/5
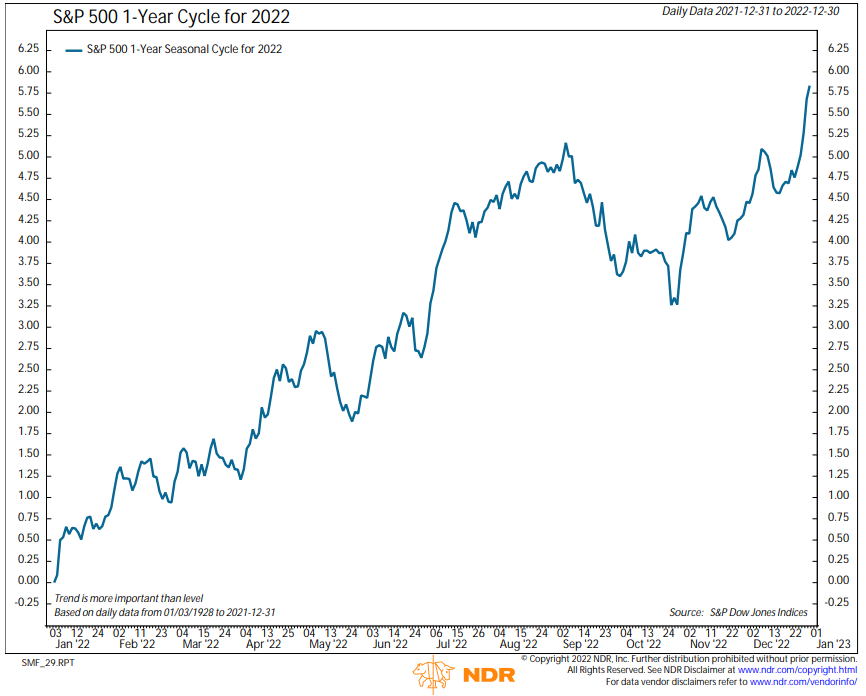
3. CPI report on Tues is the big report of the week. Can stocks rally with high inflation? Yes, if it's high *and* falling. The y/y CPI is likely to fall below its 6-month moving average, but in reality this cycle the market has already rallied in anticipation of it. 3/5
4. The 26-week change in the commodity prices fell below 4% for the first time since Aug 2020. 4/5
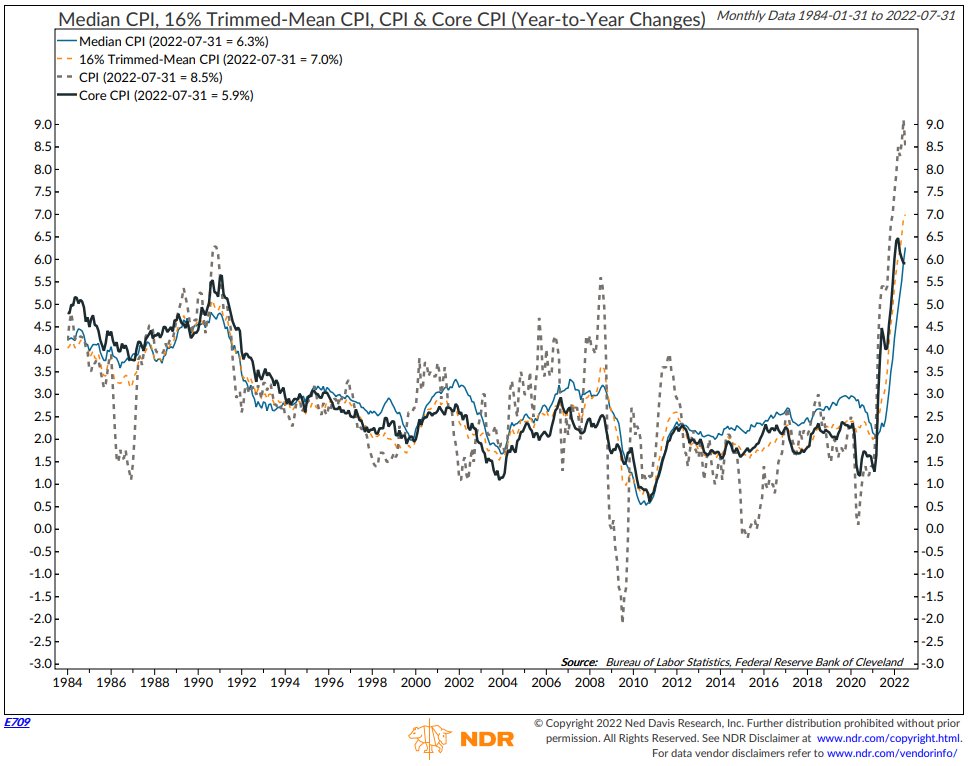
5. Not everything is rosy on the inflation front. The core CPI hasn't rolled over as quickly. Stocks have risen at a slower rate when the overall CPI has been greater than the core CPI. Perhaps low food and energy prices are good, but inflation broadly contained is better? 5/5

• • •

Missing some Tweet in this thread? You can try to force a refresh
 

Keep Current with Ed Clissold

Ed Clissold Profile picture

Stay in touch and get notified when new unrolls are available from this author!

Read all threads

This Thread may be Removed Anytime!

PDF

Twitter may remove this content at anytime! Save it as PDF for later use!

Try unrolling a thread yourself!

how to unroll video
  1. Follow @ThreadReaderApp to mention us!

  2. From a Twitter thread mention us with a keyword "unroll"
@threadreaderapp unroll

Practice here first or read more on our help page!

More from @edclissold

Aug 29
Going thru charts, these 5 stood out:
1. With all the focus on the Fed, don't forget fiscal policy has been very tight for over a year. The @NDR_Research Monetary & Fiscal Policy Index peaked in March 2021. On y/y basis, it's been getting less bad even as the Fed tightened. 1/5
2. An improvement in gov't policy would be in line with the presidential cycle. Monetary & fiscal policy tends to be restrictive after the presidential election, trough before midterm elections, and accelerate into the presidential election. r/t @WillieDelwiche 2/5
3. Another way to say fiscal policy is tightening is that the deficit is shrinking. From 9.6% to 3.9% of GPD in a yr. Still >75yr avg of 3.0%. Dems blame tax cuts, Reps blame spending. Both are true. Taxes/GDP are 2.1% pts below the LT avg and spending is 3.0% pts above. 3/5
Read 5 tweets
Aug 22
Going thru charts, these 5 stood out:
1. 50-day MA breadth just missed. Hit 89.66% on 8/16. Breadth thrust is 90.0%. The difference is probably insignificant, but the indicator is built at 90. Close counts for horseshoes and hand grenades, not breadth thrusts. @NDR_Research 1/5
2. Recent weakness is in line with the NDR Cycle Composite. Highs on 8/23 and 9/8 and low on 9/30.
The Cycle Composite is based on historical trends. It's NOT a forecast. The market tends to follow but some years macro forces outweigh it. Trend is more important than level. 2/5
3. @NDR_Research Cycle Composite is the average of the 1, 4, and 10-year cycles. The 1-year cycle posts a summer high on 9/6 and a low on 10/25. I'm giving exact dates but don't get hung up on them. Different number of trading days some months make lining up for 2022 tricky. 3/5
Read 5 tweets
Aug 15
Going thru charts, these 5 stood out:
Big picture: One of the biggest gaps between bullish technicals and macro concerns I can remember.
1. 89% of stocks in @NDR_Research universe >50-day moving averages, just shy of 90% breadth thrust threshold. Note: $SPX got there (92%). 1/5
2. 50-day breadth signal about now would be right on schedule. Has fired a median of 1.8 months after bear market low, which equates to last Thursday, 8/11, this cycle. Mean of 2.7 months equates to Sept 6, day after Labor Day. 2/5
3. Now for macro concerns:
As much of a positive surprise the July CPI was, less volatile measures rose, including median CPI and trimmed mean CPI. 3/5
Read 6 tweets
Jul 20
Going thru charts, these 5 stood out:
1. Tuesday was a 17:1 up day (advancing volume/declining volume), the best day since 3/24/2020. Combined with Friday's 11:1, it's the 2nd 10:1 up day in 3 sessions. @NDR_Research 1/5 Image
2. After 2x 10:1 up days within 3 months without a 10:1 down day in between, $SPX has more than doubled its LT average gain 1, 3, and 6 months later, on average. 2/5 Image
3. The % stocks > 10-day M.A. is close to the key 90% threshold. After the March and May lows, breadth improved quickly, but then faded. Given the volatility, confirmation from more breadth thrust indicators would be good. Trust but verify. 3/5 Image
Read 5 tweets
Jul 5
Going thru charts, these 5 stood out:
1. Q2 was bad. Is that good? After $SPX ⬇️15% in a qtr, it has rebounded sharply. Post WWII⬆️7/8 times next quarter. 2 qtrs later⬆️8/8 by median of 15%. If economy isn't in a deep recession, history suggests stocks rebound. @NDR_Research 1/5
2. Nightmare on Asset Allocation Street. 60/40 stock/bond portfolio posted worst 1H since 1932. 2/5
3. Nowhere to hide outside of commodities. 7 asset classes ⬇️>7% for first time since at least 1981. LC US, SC US, developed int'l, emerging markets, Treasuries, corporates, and REITS. 3/5
Read 5 tweets
May 31
Going thru charts, these 5 stood out:
1. Last week's rally triggered a couple of breadth thrusts. Here's one based on the 5-day advance/declines ratio, courtesy of the great Jim Stack. @NDR_Research 1/5 Image
2. Friday was a 11:1 up day based on our database of common stocks. That follows one on May 13, but because May 18 was a 10:1 down day, another 10:1 up day is needed for a double 10:1 breadth thrust signal. (w/o a 10:1 down day in between). 2/5 Image
3. The March rally triggered some breadth thrusts, too, so I'm watching for confirmation from some that have been harder to hit lately. The 10-day advances/declines ratio hasn't fired since Feb 2021. 3/5 Image
Read 5 tweets

Did Thread Reader help you today?

Support us! We are indie developers!


This site is made by just two indie developers on a laptop doing marketing, support and development! Read more about the story.

Become a Premium Member ($3/month or $30/year) and get exclusive features!

Become Premium

Don't want to be a Premium member but still want to support us?

Make a small donation by buying us coffee ($5) or help with server cost ($10)

Donate via Paypal

Or Donate anonymously using crypto!

Ethereum

0xfe58350B80634f60Fa6Dc149a72b4DFbc17D341E copy

Bitcoin

3ATGMxNzCUFzxpMCHL5sWSt4DVtS8UqXpi copy

Thank you for your support!

Follow Us on Twitter!

:(