Chandoo.org Profile picture
Sep 23 8 tweets 3 min read
Power BI is a highly sought after skill for data folks. It makes the process of data analysis simple and easy. If you ever wanted to learn what all the fuss is about, this tweetorial is for you. 🧵
1) What is it? Power BI is a data analysis & visualization software. We can use it to load up and clean any data, analyze it, visualize it and share the outcomes with others easily.
2) How to get it - The Power BI Desktop software is FREE!. Download it from powerbi.micrsoft.com
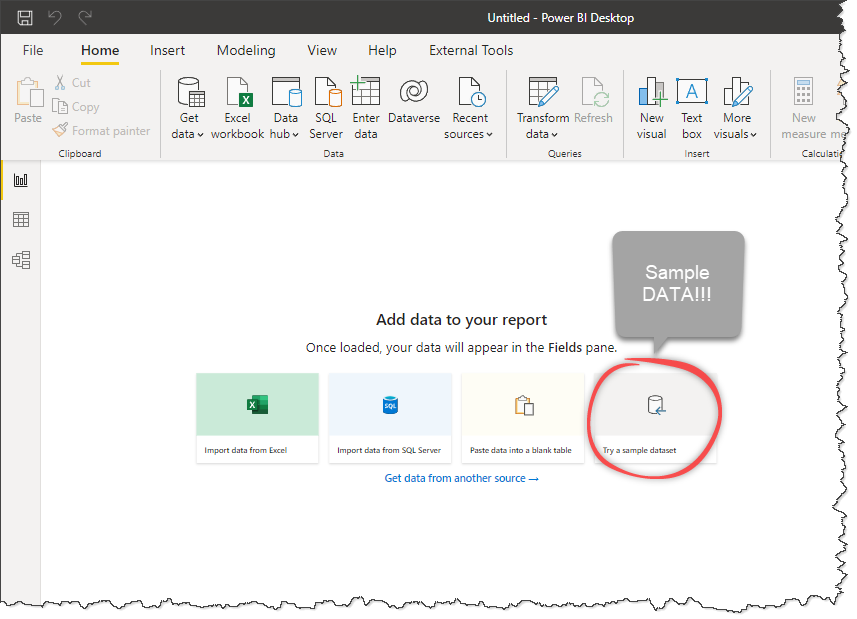
3) Getting started: You can load up any of your datasets or use the built-in "sample data".
4) How to use it? The Power BI screen is divided into 5 main areas. 1️⃣Ribbon for all features & options 2️⃣ Canvas area for your graphs 3️⃣ Fields panel 4️⃣ Visuals panel for making graphs 5️⃣ to change the view.
5) Making your first visual: Select the visual type from fields panel 3️⃣ and add relevant axis & value fields (X & Y for most graphs). Customize it from Visuals panel 4️⃣. Here is a quick GIF demo 👇
6) Interactions: PowerBI graphs talk to each other🗣👂
If you click on one graph, the others show the relevant bits. See this demo 👇
7) Next steps:
☝ Try it out with your own data. It's easy!
✌ Watch this tutorial for your first 10 minutes -
👌 Read this for more examples & resources - chandoo.org/wp/powerbi-int…
🙏 Fav ❤ and Retweet to share this info with others

• • •

Missing some Tweet in this thread? You can try to force a refresh
 

Keep Current with Chandoo.org

Chandoo.org Profile picture

Stay in touch and get notified when new unrolls are available from this author!

Read all threads

This Thread may be Removed Anytime!

PDF

Twitter may remove this content at anytime! Save it as PDF for later use!

Try unrolling a thread yourself!

how to unroll video
  1. Follow @ThreadReaderApp to mention us!

  2. From a Twitter thread mention us with a keyword "unroll"
@threadreaderapp unroll

Practice here first or read more on our help page!

More from @r1c1

Sep 13
I made 10,000+ charts 📈📊📉 in my life. Here are 6 simple rules that help me create amazing charts consistently.🧵
#1 - Write punchy, clear titles
#2 - Sort your charts in a meaningful way
Read 8 tweets
Sep 5
Excel has 100s of functions. Most them are not useful in day to day business setting. Here are the 10 most useful functions based on my 15 years of regular usage.
🧵
1) SUMIFS
Use it to add up values that meet one or more conditions.
=SUMIFS(A1:A100, B1:B100, "NZ", C1:C100, ">20") adds up all values in A1:A100 where column B is NZ and column C is more than 20.
2) XLOOKUP*
Use it to lookup a value and get corresponding value.
=XLOOKUP("Widget10", A1:A100, B1:B100)
looks the code Widget10 in column A and returns the price in column B.
* Works in Excel 365 / Web only
Read 12 tweets

Did Thread Reader help you today?

Support us! We are indie developers!


This site is made by just two indie developers on a laptop doing marketing, support and development! Read more about the story.

Become a Premium Member ($3/month or $30/year) and get exclusive features!

Become Premium

Don't want to be a Premium member but still want to support us?

Make a small donation by buying us coffee ($5) or help with server cost ($10)

Donate via Paypal

Or Donate anonymously using crypto!

Ethereum

0xfe58350B80634f60Fa6Dc149a72b4DFbc17D341E copy

Bitcoin

3ATGMxNzCUFzxpMCHL5sWSt4DVtS8UqXpi copy

Thank you for your support!

Follow Us on Twitter!

:(